
 Yahoo Finance
 Technical Overview of Gold, Silver & US Dollar Index: 12.10.2018
GOLD
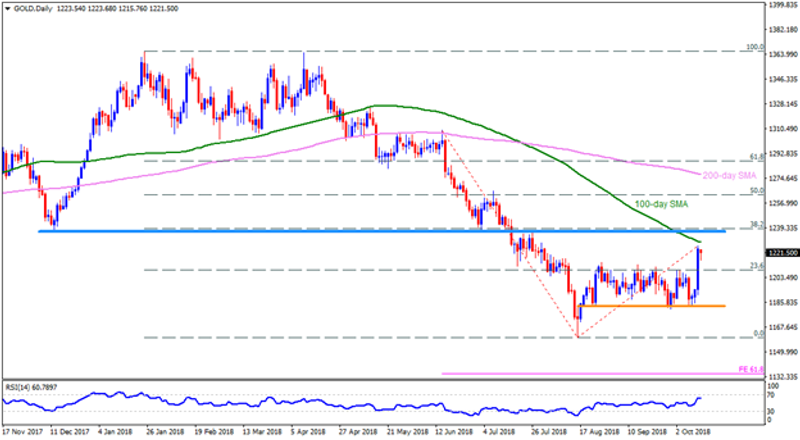
Trading near ten-weeks’ high isn’t speaking loud for the Gold’s strength as 100-day SMA level of $1229 & $1236-38 horizontal-region still stand tall to challenge the buyers. In case the bullion surpasses the $1238 resistance, it’s rally to $1250-51 & $1266-67 can be expected but the $1278 barrier, comprising 200-day SMA, may disappoint optimists then after. Alternatively, the $1215-13 could entertain short-term sellers before offering them the $1200 round-figure. However, $1183-81 support-zone might confine the metal’s downside past-1200, if not then $1171 & $1160 could come-back on the chart.
SILVER

Unlike Gold, which is near to resistance, break of 50-day SMA gives some room to Silver on the upside prior to confronting an important hurdle, namely three-month old descending TL, at $14.80 now. Should prices rise beyond $14.80 on a daily closing basis, the $15.00 & $15.20 can please the Bulls ahead of troubling them with 100-day SMA level of $15.35. Meanwhile, a D1 close beneath the $14.55 mark, including 50-day SMA, can drag the metal back to $14.30 whereas immediate upward slanting support-line, around $14.25-20, may limit its following declines. Assuming the quote’s extended slide below $14.20, the $13.90 and the 61.8% FE level of $13.50 could flash on the Bears’ radar to target.
US Dollar Index [I.USDX]
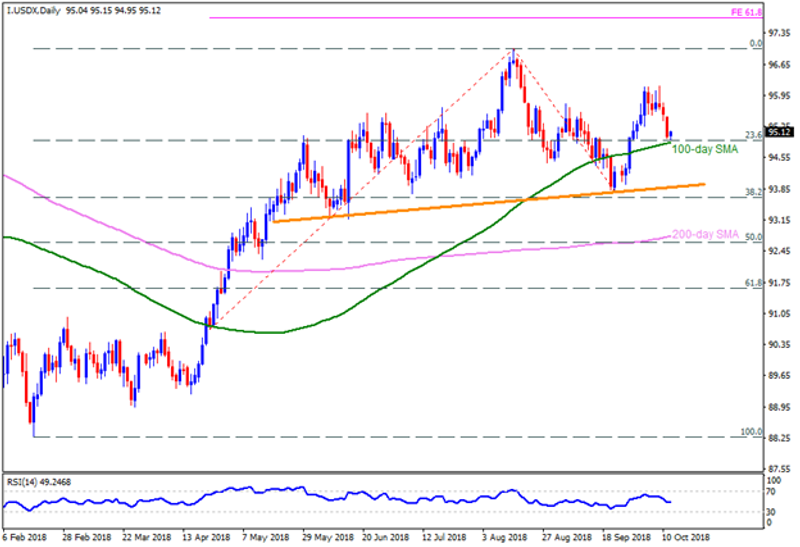
100-day SMA becomes important not only for the Gold but also for the US Dollar Index; though, here it’s working as a strong support and can trigger the gauge’s swing to 95.35 & 95.80 numbers. If the greenback index refrain to respect the 95.80 mark, the 96.15, the 97.00 and the 61.8% FE level of 97.70 seem crucial to observe. Given the indicator’s failure to bounce off the 100-day SMA level of 94.85, the 94.40 and an ascending trend-line, at 93.80, may gain market attention. Moreover, a daily close below 93.80 could make the USDX vulnerable enough to plunge towards 200-day SMA level of 92.75.
This article was originally posted on FX Empire
More From FXEMPIRE:
China’s Trade Surplus Defies Gravity Again to Shift Focus to Trump and the USD
Stock Market Sell-off: Trump Blames Fed, but Seasonality Also Factor
Natural Gas Price Fundamental Daily Forecast – Strengthens Over $3.239, Weakens Under $3.208
Gold Slips after Hitting a 10-Week High despite Weak US Greenback
Technical Overview of Gold, Silver & US Dollar Index: 12.10.2018
