
 Yahoo Finance
 Teekay (NYSE:TK) investors are sitting on a loss of 54% if they invested five years ago
While not a mind-blowing move, it is good to see that the Teekay Corporation (NYSE:TK) share price has gained 28% in the last three months. But that doesn't change the fact that the returns over the last half decade have been disappointing. Indeed, the share price is down 56% in the period. Some might say the recent bounce is to be expected after such a bad drop. Of course, this could be the start of a turnaround.
Since shareholders are down over the longer term, lets look at the underlying fundamentals over the that time and see if they've been consistent with returns.
Check out our latest analysis for Teekay
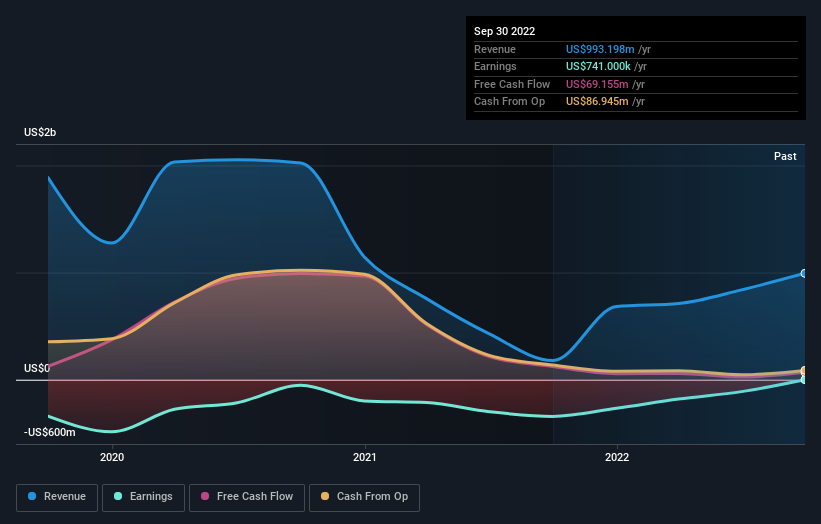
Given that Teekay only made minimal earnings in the last twelve months, we'll focus on revenue to gauge its business development. As a general rule, we think this kind of company is more comparable to loss-making stocks, since the actual profit is so low. For shareholders to have confidence a company will grow profits significantly, it must grow revenue.
In the last five years Teekay saw its revenue shrink by 21% per year. That puts it in an unattractive cohort, to put it mildly. It seems appropriate, then, that the share price slid about 9% annually during that time. It's fair to say most investors don't like to invest in loss making companies with falling revenue. You'd want to research this company pretty thoroughly before buying, it looks a bit too risky for us.
The image below shows how earnings and revenue have tracked over time (if you click on the image you can see greater detail).
Take a more thorough look at Teekay's financial health with this free report on its balance sheet.
What About The Total Shareholder Return (TSR)?
Investors should note that there's a difference between Teekay's total shareholder return (TSR) and its share price change, which we've covered above. The TSR is a return calculation that accounts for the value of cash dividends (assuming that any dividend received was reinvested) and the calculated value of any discounted capital raisings and spin-offs. Teekay's TSR of was a loss of 54% for the 5 years. That wasn't as bad as its share price return, because it has paid dividends.
A Different Perspective
We're pleased to report that Teekay shareholders have received a total shareholder return of 38% over one year. That certainly beats the loss of about 9% per year over the last half decade. This makes us a little wary, but the business might have turned around its fortunes. While it is well worth considering the different impacts that market conditions can have on the share price, there are other factors that are even more important. Consider for instance, the ever-present spectre of investment risk. We've identified 1 warning sign with Teekay , and understanding them should be part of your investment process.
Of course Teekay may not be the best stock to buy. So you may wish to see this free collection of growth stocks.
Please note, the market returns quoted in this article reflect the market weighted average returns of stocks that currently trade on US exchanges.
Have feedback on this article? Concerned about the content? Get in touch with us directly. Alternatively, email editorial-team (at) simplywallst.com.
This article by Simply Wall St is general in nature. We provide commentary based on historical data and analyst forecasts only using an unbiased methodology and our articles are not intended to be financial advice. It does not constitute a recommendation to buy or sell any stock, and does not take account of your objectives, or your financial situation. We aim to bring you long-term focused analysis driven by fundamental data. Note that our analysis may not factor in the latest price-sensitive company announcements or qualitative material. Simply Wall St has no position in any stocks mentioned.
Join A Paid User Research Session
You’ll receive a US$30 Amazon Gift card for 1 hour of your time while helping us build better investing tools for the individual investors like yourself. Sign up here
