
 Yahoo Finance
 Should You Be Tempted To Buy TEGNA Inc (NYSE:TGNA) At Its Current PE Ratio?

This article is intended for those of you who are at the beginning of your investing journey and want to begin learning about how to value company based on its current earnings and what are the drawbacks of this method.
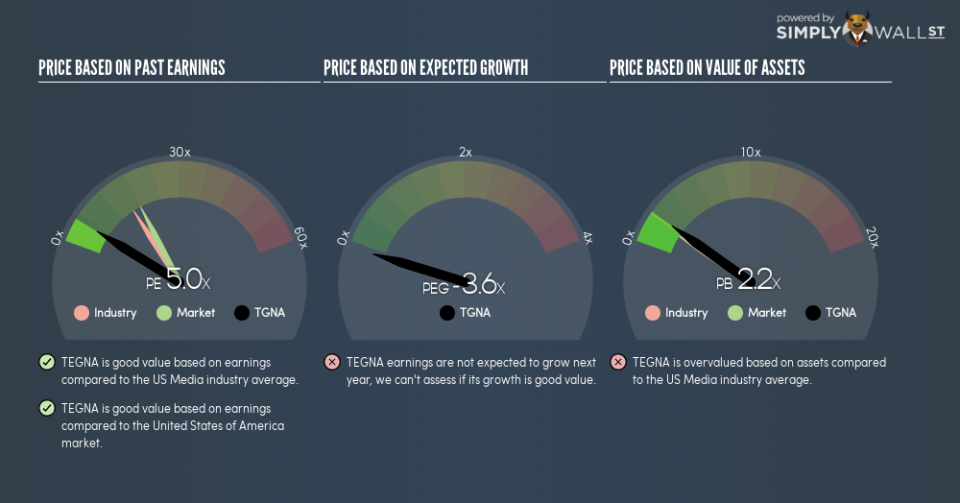
TEGNA Inc (NYSE:TGNA) trades with a trailing P/E of 5x, which is lower than the industry average of 16x. While TGNA might seem like an attractive stock to buy, it is important to understand the assumptions behind the P/E ratio before you make any investment decisions. In this article, I will deconstruct the P/E ratio and highlight what you need to be careful of when using the P/E ratio.
View our latest analysis for TEGNA
Breaking down the Price-Earnings ratio
P/E is often used for relative valuation since earnings power is a chief driver of investment value. By comparing a stock’s price per share to its earnings per share, we are able to see how much investors are paying for each dollar of the company’s earnings.
P/E Calculation for TGNA
Price-Earnings Ratio = Price per share ÷ Earnings per share
TGNA Price-Earnings Ratio = $11.58 ÷ $2.322 = 5x
The P/E ratio itself doesn’t tell you a lot; however, it becomes very insightful when you compare it with other similar companies. We preferably want to compare the stock’s P/E ratio to the average of companies that have similar features to TGNA, such as capital structure and profitability. A quick method of creating a peer group is to use companies in the same industry, which is what I will do. At 5x, TGNA’s P/E is lower than its industry peers (16x). This implies that investors are undervaluing each dollar of TGNA’s earnings. This multiple is a median of profitable companies of 24 Media companies in US including Commerce Planet, Global Gateway Media & Communications and Emmis Communications. Therefore, according to this analysis, TGNA is an under-priced stock.
Assumptions to be aware of
However, before you rush out to buy TGNA, it is important to note that this conclusion is based on two key assumptions. Firstly, our peer group contains companies that are similar to TGNA. If this isn’t the case, the difference in P/E could be due to other factors. For example, if you compared higher growth firms with TGNA, then its P/E would naturally be lower since investors would reward its peers’ higher growth with a higher price. The second assumption that must hold true is that the stocks we are comparing TGNA to are fairly valued by the market. If this does not hold true, TGNA’s lower P/E ratio may be because firms in our peer group are overvalued by the market.
What this means for you:
You may have already conducted fundamental analysis on the stock as a shareholder, so its current undervaluation could signal a good buying opportunity to increase your exposure to TGNA. Now that you understand the ins and outs of the PE metric, you should know to bear in mind its limitations before you make an investment decision. Remember that basing your investment decision off one metric alone is certainly not sufficient. There are many things I have not taken into account in this article and the PE ratio is very one-dimensional. If you have not done so already, I highly recommend you to complete your research by taking a look at the following:
Future Outlook: What are well-informed industry analysts predicting for TGNA’s future growth? Take a look at our free research report of analyst consensus for TGNA’s outlook.
Past Track Record: Has TGNA been consistently performing well irrespective of the ups and downs in the market? Go into more detail in the past performance analysis and take a look at the free visual representations of TGNA’s historicals for more clarity.
Other High-Performing Stocks: Are there other stocks that provide better prospects with proven track records? Explore our free list of these great stocks here.
To help readers see past the short term volatility of the financial market, we aim to bring you a long-term focused research analysis purely driven by fundamental data. Note that our analysis does not factor in the latest price-sensitive company announcements.
The author is an independent contributor and at the time of publication had no position in the stocks mentioned. For errors that warrant correction please contact the editor at editorial-team@simplywallst.com.
