
 Yahoo Finance
 There's Been No Shortage Of Growth Recently For Quanex Building Products' (NYSE:NX) Returns On Capital
There are a few key trends to look for if we want to identify the next multi-bagger. Ideally, a business will show two trends; firstly a growing return on capital employed (ROCE) and secondly, an increasing amount of capital employed. This shows us that it's a compounding machine, able to continually reinvest its earnings back into the business and generate higher returns. Speaking of which, we noticed some great changes in Quanex Building Products' (NYSE:NX) returns on capital, so let's have a look.
Return On Capital Employed (ROCE): What is it?
Just to clarify if you're unsure, ROCE is a metric for evaluating how much pre-tax income (in percentage terms) a company earns on the capital invested in its business. Analysts use this formula to calculate it for Quanex Building Products:
Return on Capital Employed = Earnings Before Interest and Tax (EBIT) ÷ (Total Assets - Current Liabilities)
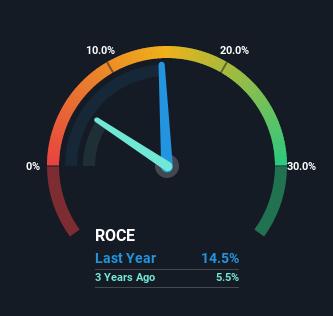
0.14 = US$85m ÷ (US$718m - US$132m) (Based on the trailing twelve months to January 2022).
Therefore, Quanex Building Products has an ROCE of 14%. In absolute terms, that's a pretty normal return, and it's somewhat close to the Building industry average of 13%.
View our latest analysis for Quanex Building Products
In the above chart we have measured Quanex Building Products' prior ROCE against its prior performance, but the future is arguably more important. If you're interested, you can view the analysts predictions in our free report on analyst forecasts for the company.
What The Trend Of ROCE Can Tell Us
Quanex Building Products is showing promise given that its ROCE is trending up and to the right. The figures show that over the last five years, ROCE has grown 81% whilst employing roughly the same amount of capital. So it's likely that the business is now reaping the full benefits of its past investments, since the capital employed hasn't changed considerably. On that front, things are looking good so it's worth exploring what management has said about growth plans going forward.
The Key Takeaway
In summary, we're delighted to see that Quanex Building Products has been able to increase efficiencies and earn higher rates of return on the same amount of capital. Considering the stock has delivered 17% to its stockholders over the last five years, it may be fair to think that investors aren't fully aware of the promising trends yet. So exploring more about this stock could uncover a good opportunity, if the valuation and other metrics stack up.
While Quanex Building Products looks impressive, no company is worth an infinite price. The intrinsic value infographic in our free research report helps visualize whether NX is currently trading for a fair price.
For those who like to invest in solid companies, check out this free list of companies with solid balance sheets and high returns on equity.
Have feedback on this article? Concerned about the content? Get in touch with us directly. Alternatively, email editorial-team (at) simplywallst.com.
This article by Simply Wall St is general in nature. We provide commentary based on historical data and analyst forecasts only using an unbiased methodology and our articles are not intended to be financial advice. It does not constitute a recommendation to buy or sell any stock, and does not take account of your objectives, or your financial situation. We aim to bring you long-term focused analysis driven by fundamental data. Note that our analysis may not factor in the latest price-sensitive company announcements or qualitative material. Simply Wall St has no position in any stocks mentioned.
