
 Yahoo Finance
 There's Been No Shortage Of Growth Recently For Contact Energy's (NZSE:CEN) Returns On Capital
Did you know there are some financial metrics that can provide clues of a potential multi-bagger? Firstly, we'd want to identify a growing return on capital employed (ROCE) and then alongside that, an ever-increasing base of capital employed. If you see this, it typically means it's a company with a great business model and plenty of profitable reinvestment opportunities. With that in mind, we've noticed some promising trends at Contact Energy (NZSE:CEN) so let's look a bit deeper.
Return On Capital Employed (ROCE): What Is It?
For those who don't know, ROCE is a measure of a company's yearly pre-tax profit (its return), relative to the capital employed in the business. The formula for this calculation on Contact Energy is:
Return on Capital Employed = Earnings Before Interest and Tax (EBIT) ÷ (Total Assets - Current Liabilities)
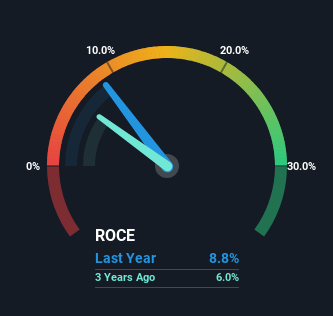
0.088 = NZ$464m ÷ (NZ$6.1b - NZ$802m) (Based on the trailing twelve months to December 2023).
So, Contact Energy has an ROCE of 8.8%. In absolute terms, that's a low return, but it's much better than the Electric Utilities industry average of 6.0%.
Check out our latest analysis for Contact Energy
In the above chart we have measured Contact Energy's prior ROCE against its prior performance, but the future is arguably more important. If you're interested, you can view the analysts predictions in our free analyst report for Contact Energy .
So How Is Contact Energy's ROCE Trending?
Contact Energy is showing promise given that its ROCE is trending up and to the right. More specifically, while the company has kept capital employed relatively flat over the last five years, the ROCE has climbed 34% in that same time. Basically the business is generating higher returns from the same amount of capital and that is proof that there are improvements in the company's efficiencies. On that front, things are looking good so it's worth exploring what management has said about growth plans going forward.
The Bottom Line
In summary, we're delighted to see that Contact Energy has been able to increase efficiencies and earn higher rates of return on the same amount of capital. Since the stock has returned a solid 68% to shareholders over the last five years, it's fair to say investors are beginning to recognize these changes. Therefore, we think it would be worth your time to check if these trends are going to continue.
Contact Energy does come with some risks though, we found 2 warning signs in our investment analysis, and 1 of those is a bit unpleasant...
For those who like to invest in solid companies, check out this free list of companies with solid balance sheets and high returns on equity.
Have feedback on this article? Concerned about the content? Get in touch with us directly. Alternatively, email editorial-team (at) simplywallst.com.
This article by Simply Wall St is general in nature. We provide commentary based on historical data and analyst forecasts only using an unbiased methodology and our articles are not intended to be financial advice. It does not constitute a recommendation to buy or sell any stock, and does not take account of your objectives, or your financial situation. We aim to bring you long-term focused analysis driven by fundamental data. Note that our analysis may not factor in the latest price-sensitive company announcements or qualitative material. Simply Wall St has no position in any stocks mentioned.
