
 Yahoo Finance
 Those who invested in ABM Industries (NYSE:ABM) five years ago are up 35%
The main point of investing for the long term is to make money. Better yet, you'd like to see the share price move up more than the market average. Unfortunately for shareholders, while the ABM Industries Incorporated (NYSE:ABM) share price is up 22% in the last five years, that's less than the market return. The last year hasn't been great either, with the stock up just 2.5%.
Let's take a look at the underlying fundamentals over the longer term, and see if they've been consistent with shareholders returns.
Check out our latest analysis for ABM Industries
In his essay The Superinvestors of Graham-and-Doddsville Warren Buffett described how share prices do not always rationally reflect the value of a business. One imperfect but simple way to consider how the market perception of a company has shifted is to compare the change in the earnings per share (EPS) with the share price movement.
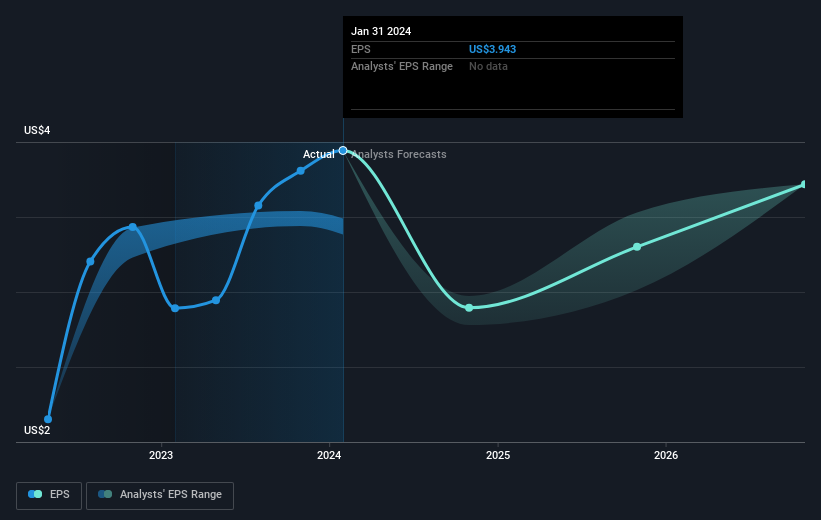
Over half a decade, ABM Industries managed to grow its earnings per share at 27% a year. The EPS growth is more impressive than the yearly share price gain of 4% over the same period. Therefore, it seems the market has become relatively pessimistic about the company. The reasonably low P/E ratio of 10.96 also suggests market apprehension.
The image below shows how EPS has tracked over time (if you click on the image you can see greater detail).
We know that ABM Industries has improved its bottom line over the last three years, but what does the future have in store? If you are thinking of buying or selling ABM Industries stock, you should check out this FREE detailed report on its balance sheet.
What About Dividends?
As well as measuring the share price return, investors should also consider the total shareholder return (TSR). Whereas the share price return only reflects the change in the share price, the TSR includes the value of dividends (assuming they were reinvested) and the benefit of any discounted capital raising or spin-off. It's fair to say that the TSR gives a more complete picture for stocks that pay a dividend. We note that for ABM Industries the TSR over the last 5 years was 35%, which is better than the share price return mentioned above. The dividends paid by the company have thusly boosted the total shareholder return.
A Different Perspective
ABM Industries provided a TSR of 5.2% over the last twelve months. But that return falls short of the market. On the bright side, the longer term returns (running at about 6% a year, over half a decade) look better. It's quite possible the business continues to execute with prowess, even as the share price gains are slowing. I find it very interesting to look at share price over the long term as a proxy for business performance. But to truly gain insight, we need to consider other information, too. For instance, we've identified 4 warning signs for ABM Industries (1 doesn't sit too well with us) that you should be aware of.
For those who like to find winning investments this free list of growing companies with recent insider purchasing, could be just the ticket.
Please note, the market returns quoted in this article reflect the market weighted average returns of stocks that currently trade on American exchanges.
Have feedback on this article? Concerned about the content? Get in touch with us directly. Alternatively, email editorial-team (at) simplywallst.com.
This article by Simply Wall St is general in nature. We provide commentary based on historical data and analyst forecasts only using an unbiased methodology and our articles are not intended to be financial advice. It does not constitute a recommendation to buy or sell any stock, and does not take account of your objectives, or your financial situation. We aim to bring you long-term focused analysis driven by fundamental data. Note that our analysis may not factor in the latest price-sensitive company announcements or qualitative material. Simply Wall St has no position in any stocks mentioned.
