
 Yahoo Finance
 Those who invested in Chorus (NZSE:CNU) five years ago are up 66%
Stock pickers are generally looking for stocks that will outperform the broader market. Buying under-rated businesses is one path to excess returns. For example, long term Chorus Limited (NZSE:CNU) shareholders have enjoyed a 31% share price rise over the last half decade, well in excess of the market decline of around 2.2% (not including dividends). However, more recent returns haven't been as impressive as that, with the stock returning just 1.4% in the last year , including dividends .
So let's investigate and see if the longer term performance of the company has been in line with the underlying business' progress.
Check out our latest analysis for Chorus
While markets are a powerful pricing mechanism, share prices reflect investor sentiment, not just underlying business performance. One way to examine how market sentiment has changed over time is to look at the interaction between a company's share price and its earnings per share (EPS).
During five years of share price growth, Chorus actually saw its EPS drop 21% per year.
Essentially, it doesn't seem likely that investors are focused on EPS. Since the change in EPS doesn't seem to correlate with the change in share price, it's worth taking a look at other metrics.
We note that the dividend is higher than it was previously - always nice to see. It could be that the company is reaching maturity and dividend investors are buying for the yield.
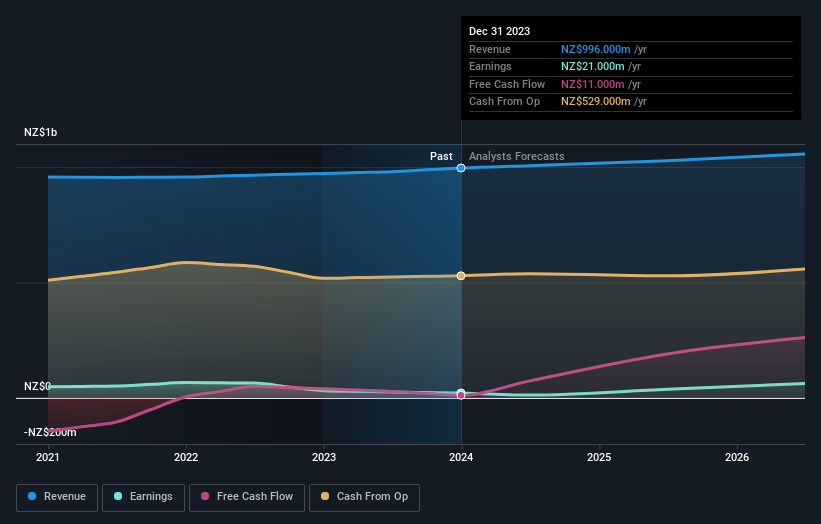
You can see below how earnings and revenue have changed over time (discover the exact values by clicking on the image).
We consider it positive that insiders have made significant purchases in the last year. Even so, future earnings will be far more important to whether current shareholders make money. This free report showing analyst forecasts should help you form a view on Chorus
What About Dividends?
As well as measuring the share price return, investors should also consider the total shareholder return (TSR). The TSR incorporates the value of any spin-offs or discounted capital raisings, along with any dividends, based on the assumption that the dividends are reinvested. So for companies that pay a generous dividend, the TSR is often a lot higher than the share price return. As it happens, Chorus' TSR for the last 5 years was 66%, which exceeds the share price return mentioned earlier. And there's no prize for guessing that the dividend payments largely explain the divergence!
A Different Perspective
Chorus shareholders gained a total return of 1.4% during the year. But that was short of the market average. On the bright side, the longer term returns (running at about 11% a year, over half a decade) look better. It may well be that this is a business worth popping on the watching, given the continuing positive reception, over time, from the market. While it is well worth considering the different impacts that market conditions can have on the share price, there are other factors that are even more important. Take risks, for example - Chorus has 4 warning signs (and 2 which shouldn't be ignored) we think you should know about.
There are plenty of other companies that have insiders buying up shares. You probably do not want to miss this free list of growing companies that insiders are buying.
Please note, the market returns quoted in this article reflect the market weighted average returns of stocks that currently trade on New Zealander exchanges.
Have feedback on this article? Concerned about the content? Get in touch with us directly. Alternatively, email editorial-team (at) simplywallst.com.
This article by Simply Wall St is general in nature. We provide commentary based on historical data and analyst forecasts only using an unbiased methodology and our articles are not intended to be financial advice. It does not constitute a recommendation to buy or sell any stock, and does not take account of your objectives, or your financial situation. We aim to bring you long-term focused analysis driven by fundamental data. Note that our analysis may not factor in the latest price-sensitive company announcements or qualitative material. Simply Wall St has no position in any stocks mentioned.
