
 Yahoo Finance
 Those who invested in GSTechnologies (LON:GST) three years ago are up 905%
Generally speaking, investors are inspired to be stock pickers by the potential to find the big winners. Not every pick can be a winner, but when you pick the right stock, you can win big. Take, for example, the GSTechnologies Ltd. (LON:GST) share price, which skyrocketed 905% over three years. On the other hand, we note it's down 9.8% in about a month. We note that the broader market is down 9.4% in the last month, and this may have impacted GSTechnologies' share price. It really delights us to see such great share price performance for investors.
With that in mind, it's worth seeing if the company's underlying fundamentals have been the driver of long term performance, or if there are some discrepancies.
See our latest analysis for GSTechnologies
Given that GSTechnologies didn't make a profit in the last twelve months, we'll focus on revenue growth to form a quick view of its business development. Shareholders of unprofitable companies usually expect strong revenue growth. That's because fast revenue growth can be easily extrapolated to forecast profits, often of considerable size.
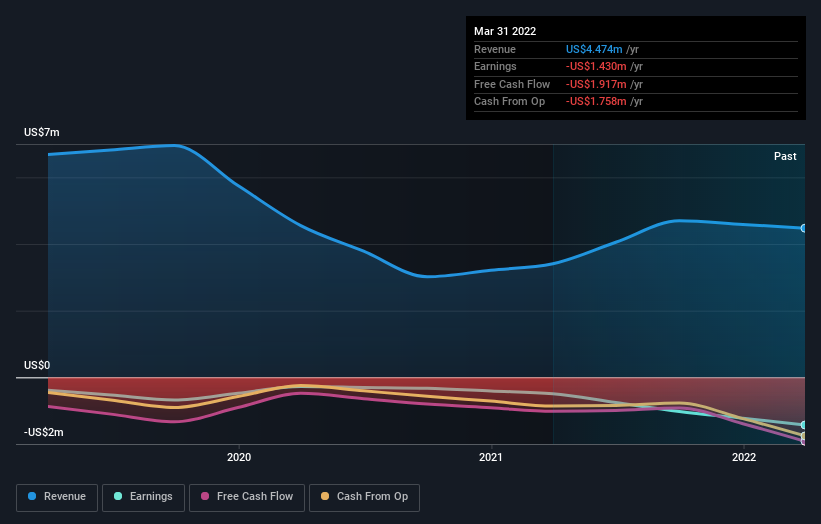
In the last 3 years GSTechnologies saw its revenue shrink by 19% per year. So it's pretty amazing to see the stock price has zoomed up 116% per year in that time. There can be no doubt this kind of decoupling of revenue growth and share price growth is unusual to see in loss making companies. So there is a serious possibility that some holders are counting their chickens before they hatch.
The graphic below depicts how earnings and revenue have changed over time (unveil the exact values by clicking on the image).
We're pleased to report that the CEO is remunerated more modestly than most CEOs at similarly capitalized companies. It's always worth keeping an eye on CEO pay, but a more important question is whether the company will grow earnings throughout the years. It might be well worthwhile taking a look at our free report on GSTechnologies' earnings, revenue and cash flow.
A Different Perspective
GSTechnologies shareholders are down 45% for the year, falling short of the market return. Meanwhile, the broader market slid about 23%, likely weighing on the stock. Investors are up over three years, booking 116% per year, much better than the more recent returns. The recent sell-off could be an opportunity if the business remains sound, so it may be worth checking the fundamental data for signs of a long-term growth trend. I find it very interesting to look at share price over the long term as a proxy for business performance. But to truly gain insight, we need to consider other information, too. Even so, be aware that GSTechnologies is showing 4 warning signs in our investment analysis , and 1 of those is a bit unpleasant...
Of course, you might find a fantastic investment by looking elsewhere. So take a peek at this free list of companies we expect will grow earnings.
Please note, the market returns quoted in this article reflect the market weighted average returns of stocks that currently trade on GB exchanges.
Have feedback on this article? Concerned about the content? Get in touch with us directly. Alternatively, email editorial-team (at) simplywallst.com.
This article by Simply Wall St is general in nature. We provide commentary based on historical data and analyst forecasts only using an unbiased methodology and our articles are not intended to be financial advice. It does not constitute a recommendation to buy or sell any stock, and does not take account of your objectives, or your financial situation. We aim to bring you long-term focused analysis driven by fundamental data. Note that our analysis may not factor in the latest price-sensitive company announcements or qualitative material. Simply Wall St has no position in any stocks mentioned.
Join A Paid User Research Session
You’ll receive a US$30 Amazon Gift card for 1 hour of your time while helping us build better investing tools for the individual investors like yourself. Sign up here
