
 Yahoo Finance
 Top Ranked Value Stocks to Buy for July 30th
Here are four stocks with buy rank and strong value characteristics for investors to consider today, July 30th:
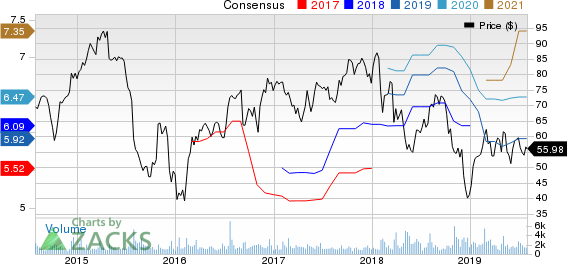
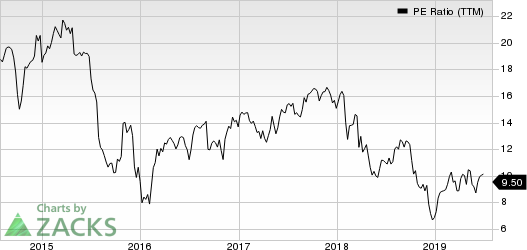
Avis Budget Group, Inc. (CAR): This provider of car and truck rentals as well as car sharing services has a Zacks Rank #1 (Strong Buy), and seen the Zacks Consensus Estimate for its current year earnings rising 1.5% over the last 60 days.
Avis Budget Group, Inc. Price and Consensus

Avis Budget Group, Inc. price-consensus-chart | Avis Budget Group, Inc. Quote
Avis Budget has a price-to-earnings ratio (P/E) of 8.91 compared with 15.40 for the industry. The company possesses a Value Score of A.
Avis Budget Group, Inc. PE Ratio (TTM)

Avis Budget Group, Inc. pe-ratio-ttm | Avis Budget Group, Inc. Quote
Koppers Holdings Inc. (KOP): This provider of treated wood products as well as wood treatment chemicals and carbon compounds has a Zacks Rank #2 (Buy), and seen the Zacks Consensus Estimate for its current year earnings rising 0.6% over the last 60 days.
Koppers Holdings Inc. Price and Consensus

Koppers Holdings Inc. price-consensus-chart | Koppers Holdings Inc. Quote
Koppers has a price-to-earnings ratio (P/E) of 7.96 compared with 13.50 for the industry. The company possesses a Value Score of B.
Koppers Holdings Inc. PE Ratio (TTM)

Koppers Holdings Inc. pe-ratio-ttm | Koppers Holdings Inc. Quote
Belden Inc. (BDC): This provider of signal transmission solutions has a Zacks Rank #2 (Buy), and seen the Zacks Consensus Estimate for its current year earnings rising 1% over the last 60 days.
Belden Inc Price and Consensus
Belden Inc price-consensus-chart | Belden Inc Quote
Belden has a price-to-earnings ratio (P/E) of 9.57 compared with 13.90 for the industry. The company possesses a Value Score of B.
Belden Inc PE Ratio (TTM)
Belden Inc pe-ratio-ttm | Belden Inc Quote
Cleveland-Cliffs Inc. (CLF): This iron ore mining company has a Zacks Rank #2 (Buy), and seen the Zacks Consensus Estimate for its current year earnings rising 9.1% over the last 60 days.
Cleveland-Cliffs Inc. Price and Consensus
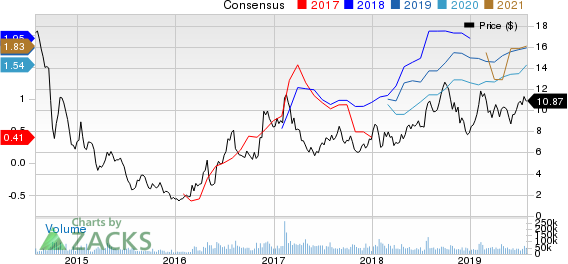
Cleveland-Cliffs Inc. price-consensus-chart | Cleveland-Cliffs Inc. Quote
Cleveland-Cliffs has a price-to-earnings ratio (P/E) of 6.05 compared with 9.10 for the industry. The company possesses a Value Score of A.
Cleveland-Cliffs Inc. PE Ratio (TTM)
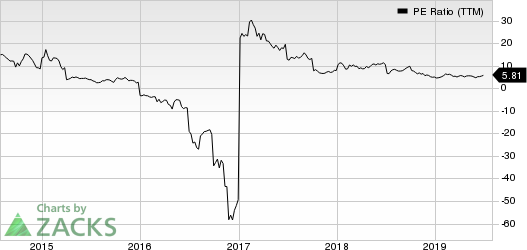
Cleveland-Cliffs Inc. pe-ratio-ttm | Cleveland-Cliffs Inc. Quote
See the full list of top ranked stocks here
Learn more about the Value score and how it is calculated here.
Today's Best Stocks from Zacks
Would you like to see the updated picks from our best market-beating strategies? From 2017 through 2018, while the S&P 500 gained +15.8%, five of our screens returned +38.0%, +61.3%, +61.6%, +68.1%, and +98.3%.
This outperformance has not just been a recent phenomenon. From 2000 – 2018, while the S&P averaged +4.8% per year, our top strategies averaged up to +56.2% per year.
See their latest picks free >>
Want the latest recommendations from Zacks Investment Research? Today, you can download 7 Best Stocks for the Next 30 Days. Click to get this free report
Koppers Holdings Inc. (KOP) : Free Stock Analysis Report
Cleveland-Cliffs Inc. (CLF) : Free Stock Analysis Report
Avis Budget Group, Inc. (CAR) : Free Stock Analysis Report
Belden Inc (BDC) : Free Stock Analysis Report
To read this article on Zacks.com click here.
Zacks Investment Research
