
 Yahoo Finance
 Under The Bonnet, CPI Card Group's (NASDAQ:PMTS) Returns Look Impressive
To find a multi-bagger stock, what are the underlying trends we should look for in a business? In a perfect world, we'd like to see a company investing more capital into its business and ideally the returns earned from that capital are also increasing. Ultimately, this demonstrates that it's a business that is reinvesting profits at increasing rates of return. So when we looked at the ROCE trend of CPI Card Group (NASDAQ:PMTS) we really liked what we saw.
Understanding Return On Capital Employed (ROCE)
Just to clarify if you're unsure, ROCE is a metric for evaluating how much pre-tax income (in percentage terms) a company earns on the capital invested in its business. To calculate this metric for CPI Card Group, this is the formula:
Return on Capital Employed = Earnings Before Interest and Tax (EBIT) ÷ (Total Assets - Current Liabilities)
0.25 = US$62m ÷ (US$294m - US$49m) (Based on the trailing twelve months to December 2023).
Therefore, CPI Card Group has an ROCE of 25%. That's a fantastic return and not only that, it outpaces the average of 8.6% earned by companies in a similar industry.
Check out our latest analysis for CPI Card Group
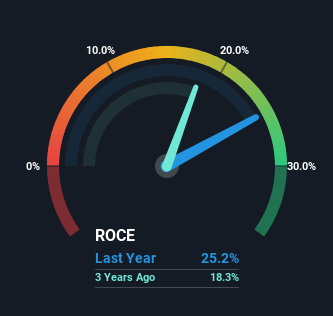
Above you can see how the current ROCE for CPI Card Group compares to its prior returns on capital, but there's only so much you can tell from the past. If you'd like, you can check out the forecasts from the analysts covering CPI Card Group for free.
What The Trend Of ROCE Can Tell Us
The trends we've noticed at CPI Card Group are quite reassuring. The data shows that returns on capital have increased substantially over the last five years to 25%. Basically the business is earning more per dollar of capital invested and in addition to that, 47% more capital is being employed now too. So we're very much inspired by what we're seeing at CPI Card Group thanks to its ability to profitably reinvest capital.
Our Take On CPI Card Group's ROCE
A company that is growing its returns on capital and can consistently reinvest in itself is a highly sought after trait, and that's what CPI Card Group has. And a remarkable 548% total return over the last five years tells us that investors are expecting more good things to come in the future. In light of that, we think it's worth looking further into this stock because if CPI Card Group can keep these trends up, it could have a bright future ahead.
On a final note, we found 3 warning signs for CPI Card Group (1 is a bit concerning) you should be aware of.
If you want to search for more stocks that have been earning high returns, check out this free list of stocks with solid balance sheets that are also earning high returns on equity.
Have feedback on this article? Concerned about the content? Get in touch with us directly. Alternatively, email editorial-team (at) simplywallst.com.
This article by Simply Wall St is general in nature. We provide commentary based on historical data and analyst forecasts only using an unbiased methodology and our articles are not intended to be financial advice. It does not constitute a recommendation to buy or sell any stock, and does not take account of your objectives, or your financial situation. We aim to bring you long-term focused analysis driven by fundamental data. Note that our analysis may not factor in the latest price-sensitive company announcements or qualitative material. Simply Wall St has no position in any stocks mentioned.
