
 Yahoo Finance
 Under The Bonnet, Lycopodium's (ASX:LYL) Returns Look Impressive
What trends should we look for it we want to identify stocks that can multiply in value over the long term? Ideally, a business will show two trends; firstly a growing return on capital employed (ROCE) and secondly, an increasing amount of capital employed. If you see this, it typically means it's a company with a great business model and plenty of profitable reinvestment opportunities. Speaking of which, we noticed some great changes in Lycopodium's (ASX:LYL) returns on capital, so let's have a look.
Understanding Return On Capital Employed (ROCE)
Just to clarify if you're unsure, ROCE is a metric for evaluating how much pre-tax income (in percentage terms) a company earns on the capital invested in its business. Analysts use this formula to calculate it for Lycopodium:
Return on Capital Employed = Earnings Before Interest and Tax (EBIT) ÷ (Total Assets - Current Liabilities)
0.25 = AU$28m ÷ (AU$219m - AU$106m) (Based on the trailing twelve months to June 2022).
Therefore, Lycopodium has an ROCE of 25%. That's a fantastic return and not only that, it outpaces the average of 14% earned by companies in a similar industry.
See our latest analysis for Lycopodium
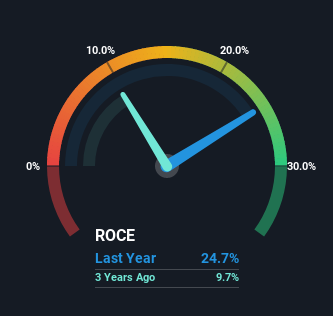
Historical performance is a great place to start when researching a stock so above you can see the gauge for Lycopodium's ROCE against it's prior returns. If you'd like to look at how Lycopodium has performed in the past in other metrics, you can view this free graph of past earnings, revenue and cash flow.
The Trend Of ROCE
Investors would be pleased with what's happening at Lycopodium. The data shows that returns on capital have increased substantially over the last five years to 25%. Basically the business is earning more per dollar of capital invested and in addition to that, 60% more capital is being employed now too. This can indicate that there's plenty of opportunities to invest capital internally and at ever higher rates, a combination that's common among multi-baggers.
On a side note, Lycopodium's current liabilities are still rather high at 49% of total assets. This can bring about some risks because the company is basically operating with a rather large reliance on its suppliers or other sorts of short-term creditors. While it's not necessarily a bad thing, it can be beneficial if this ratio is lower.
Our Take On Lycopodium's ROCE
In summary, it's great to see that Lycopodium can compound returns by consistently reinvesting capital at increasing rates of return, because these are some of the key ingredients of those highly sought after multi-baggers. And with a respectable 90% awarded to those who held the stock over the last five years, you could argue that these developments are starting to get the attention they deserve. In light of that, we think it's worth looking further into this stock because if Lycopodium can keep these trends up, it could have a bright future ahead.
If you'd like to know about the risks facing Lycopodium, we've discovered 2 warning signs that you should be aware of.
If you want to search for more stocks that have been earning high returns, check out this free list of stocks with solid balance sheets that are also earning high returns on equity.
Have feedback on this article? Concerned about the content? Get in touch with us directly. Alternatively, email editorial-team (at) simplywallst.com.
This article by Simply Wall St is general in nature. We provide commentary based on historical data and analyst forecasts only using an unbiased methodology and our articles are not intended to be financial advice. It does not constitute a recommendation to buy or sell any stock, and does not take account of your objectives, or your financial situation. We aim to bring you long-term focused analysis driven by fundamental data. Note that our analysis may not factor in the latest price-sensitive company announcements or qualitative material. Simply Wall St has no position in any stocks mentioned.
Join A Paid User Research Session
You’ll receive a US$30 Amazon Gift card for 1 hour of your time while helping us build better investing tools for the individual investors like yourself. Sign up here
