
 Yahoo Finance
 We Like These Underlying Return On Capital Trends At APM Human Services International (ASX:APM)
There are a few key trends to look for if we want to identify the next multi-bagger. Typically, we'll want to notice a trend of growing return on capital employed (ROCE) and alongside that, an expanding base of capital employed. Basically this means that a company has profitable initiatives that it can continue to reinvest in, which is a trait of a compounding machine. So on that note, APM Human Services International (ASX:APM) looks quite promising in regards to its trends of return on capital.
What Is Return On Capital Employed (ROCE)?
Just to clarify if you're unsure, ROCE is a metric for evaluating how much pre-tax income (in percentage terms) a company earns on the capital invested in its business. The formula for this calculation on APM Human Services International is:
Return on Capital Employed = Earnings Before Interest and Tax (EBIT) ÷ (Total Assets - Current Liabilities)
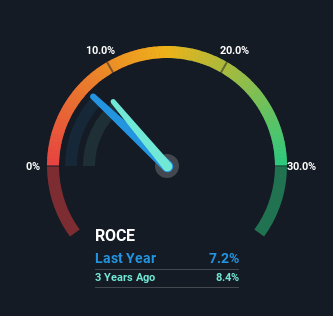
0.072 = AU$197m ÷ (AU$3.1b - AU$417m) (Based on the trailing twelve months to June 2023).
So, APM Human Services International has an ROCE of 7.2%. Ultimately, that's a low return and it under-performs the Professional Services industry average of 15%.
View our latest analysis for APM Human Services International
Above you can see how the current ROCE for APM Human Services International compares to its prior returns on capital, but there's only so much you can tell from the past. If you'd like to see what analysts are forecasting going forward, you should check out our free report for APM Human Services International.
What The Trend Of ROCE Can Tell Us
We're glad to see that ROCE is heading in the right direction, even if it is still low at the moment. Over the last four years, returns on capital employed have risen substantially to 7.2%. The amount of capital employed has increased too, by 319%. So we're very much inspired by what we're seeing at APM Human Services International thanks to its ability to profitably reinvest capital.
In another part of our analysis, we noticed that the company's ratio of current liabilities to total assets decreased to 13%, which broadly means the business is relying less on its suppliers or short-term creditors to fund its operations. This tells us that APM Human Services International has grown its returns without a reliance on increasing their current liabilities, which we're very happy with.
The Key Takeaway
To sum it up, APM Human Services International has proven it can reinvest in the business and generate higher returns on that capital employed, which is terrific. Astute investors may have an opportunity here because the stock has declined 38% in the last year. So researching this company further and determining whether or not these trends will continue seems justified.
One more thing, we've spotted 2 warning signs facing APM Human Services International that you might find interesting.
While APM Human Services International may not currently earn the highest returns, we've compiled a list of companies that currently earn more than 25% return on equity. Check out this free list here.
Have feedback on this article? Concerned about the content? Get in touch with us directly. Alternatively, email editorial-team (at) simplywallst.com.
This article by Simply Wall St is general in nature. We provide commentary based on historical data and analyst forecasts only using an unbiased methodology and our articles are not intended to be financial advice. It does not constitute a recommendation to buy or sell any stock, and does not take account of your objectives, or your financial situation. We aim to bring you long-term focused analysis driven by fundamental data. Note that our analysis may not factor in the latest price-sensitive company announcements or qualitative material. Simply Wall St has no position in any stocks mentioned.
