
 Yahoo Finance
 Union Pacific (UNP) Beats on Q1 Earnings & Revenue Estimates
Union Pacific Corporation’s UNP first-quarter 2024 earnings of $2.69 per share beat the Zacks Consensus Estimate of $2.50 per share. The bottom line improved 0.75% on a year-over-year basis. Results were aided by strong operational efficiency and favorable pricing.
Operating revenues of $6.03 billion marginally beat the Zacks Consensus Estimate of $6 billion. The top line declined 0.41% on a year-over-year basis due to core pricing gains and business mix, offset by reduced fuel surcharge revenues and lower volumes.
Freight revenues, accounting for 93.2% of the top line, decreased 1% to $5.62 billion. The actual figure was less than our estimate of $5.67 billion. Other revenues increased 4% to $415 million in the first quarter. Business volumes, measured by total revenue carloads, were down 1%.
Operating income was up 3% year over year at $2.4 billion.
Total operating expenses of $3.66 billion declined 3% year over year. Fuel expenses plunged 14%. Expenses on purchased services and materials fell by 6%.
Compensation and benefits were up 4% year over year. Other cost items declined 1% year over year.
The operating ratio (operating expenses as a percentage of revenues)
Union Pacific Corporation Price, Consensus and EPS Surprise
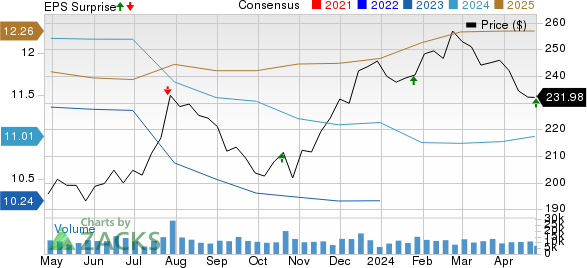
Union Pacific Corporation price-consensus-eps-surprise-chart | Union Pacific Corporation Quote
Segmental Performance
Bulk (Grain & grain products, Fertilizer, Food & refrigerated, Coal & renewables) freight revenues were $1.82 billion, which declined 4% on a year-over-year basis. However, we projected the metric to fall 0.1% from the year-ago levels. Segmental revenue carloads improved 3% year over year.
Industrial freight revenues totaled $2.1 billion, up 4% year over year. Segmental revenue carloads grew 1% year over year.
Freight revenues in the Premium division were $1.7 billion, down 3% year over year. The actual percentage decline was less than our expectation of a 1.1% fall from the prior-year levels. Premium revenue carloads improved 1%. improved by 140 basis points year over year to 60.7%.
Liquidity
Union Pacific exited the first quarter of 2024 with cash and cash equivalents of $925 million compared with $1.06 billion in the same time period in 2023. Debt (due after a year) increased to $31.20 billion at the March-end quarter from $31.16 billion at 2023-end.
Currently, Union Pacific carries a Zacks Rank #3 (Hold). You can see the complete list of today’s Zacks #1 Rank (Strong Buy) stocks here.
Outlook
The company expects current-year profitability to gain momentum due to a strong service product, improving network efficiency and solid pricing.
Management has decided to restart the share repurchase in the second quarter of 2024.
UNP still expects volumes in the current year to be muted by the international intermodal business loss, lower coal demand and soft economic conditions. Management anticipates capital expenditure of $3.4 billion for the full year.
Q1 Performances of Some Other Transportation Companies
Delta Air Lines’ DAL first-quarter 2024 earnings (excluding 39 cents from non-recurring items) of 45 cents per share comfortably beat the Zacks Consensus Estimate of $0.36 and improved 7.75% year over year.
Revenues of $13.75billion surpassed the Zacks Consensus Estimate of $12.84 billion and increased 7.75% on a year-over-year basis. Adjusted operating revenues (excluding third-party refinery sales) came in at $12.6 billion, up 6% year over year.
United Airlines UAL reported a first-quarter 2024 loss (excluding 23 cents from non-recurring items) of 15 cents per share, narrower than the Zacks Consensus Estimate of 53 cents and improved 76.19% year over year.
Operating revenues of $12.54 billion beat the Zacks Consensus Estimate of $12.43 billion. The top line increased 9.71% year over year due to upbeat air travel demand. Cargo revenues fell 1.8% year over year to $391 million. Revenues from other sources jumped 10.3% year over year to $835 million.
J.B. Hunt Transport Services’ JBHT first-quarter 2024 earnings per share of $1.22 missed the Zacks Consensus Estimate of $1.53 and declined 35.45% year over year.
Total operating revenues of $2.94 billion lagged the Zacks Consensus Estimate of $3.12 billion and fell 9% year over year. Total operating revenues, excluding fuel surcharge revenues, decreased approximately 6.5% year over year.
Want the latest recommendations from Zacks Investment Research? Today, you can download 7 Best Stocks for the Next 30 Days. Click to get this free report
Delta Air Lines, Inc. (DAL) : Free Stock Analysis Report
United Airlines Holdings Inc (UAL) : Free Stock Analysis Report
Union Pacific Corporation (UNP) : Free Stock Analysis Report
J.B. Hunt Transport Services, Inc. (JBHT) : Free Stock Analysis Report
