
 Yahoo Finance
 Unpleasant Surprises Could Be In Store For Slater and Gordon Limited's (ASX:SGH) Shares
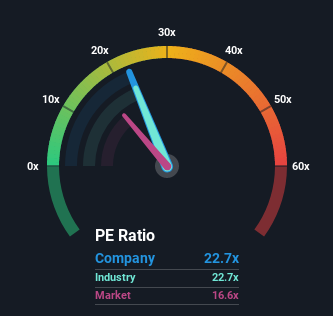
With a price-to-earnings (or "P/E") ratio of 22.7x Slater and Gordon Limited (ASX:SGH) may be sending bearish signals at the moment, given that almost half of all companies in Australia have P/E ratios under 16x and even P/E's lower than 9x are not unusual. However, the P/E might be high for a reason and it requires further investigation to determine if it's justified.
With earnings growth that's exceedingly strong of late, Slater and Gordon has been doing very well. The P/E is probably high because investors think this strong earnings growth will be enough to outperform the broader market in the near future. You'd really hope so, otherwise you're paying a pretty hefty price for no particular reason.
See our latest analysis for Slater and Gordon
Although there are no analyst estimates available for Slater and Gordon, take a look at this free data-rich visualisation to see how the company stacks up on earnings, revenue and cash flow.
What Are Growth Metrics Telling Us About The High P/E?
The only time you'd be truly comfortable seeing a P/E as high as Slater and Gordon's is when the company's growth is on track to outshine the market.
If we review the last year of earnings growth, the company posted a terrific increase of 65%. However, the latest three year period hasn't been as great in aggregate as it didn't manage to provide any growth at all. So it appears to us that the company has had a mixed result in terms of growing earnings over that time.
This is in contrast to the rest of the market, which is expected to grow by 19% over the next year, materially higher than the company's recent medium-term annualised growth rates.
In light of this, it's alarming that Slater and Gordon's P/E sits above the majority of other companies. It seems most investors are ignoring the fairly limited recent growth rates and are hoping for a turnaround in the company's business prospects. Only the boldest would assume these prices are sustainable as a continuation of recent earnings trends is likely to weigh heavily on the share price eventually.
The Key Takeaway
While the price-to-earnings ratio shouldn't be the defining factor in whether you buy a stock or not, it's quite a capable barometer of earnings expectations.
We've established that Slater and Gordon currently trades on a much higher than expected P/E since its recent three-year growth is lower than the wider market forecast. Right now we are increasingly uncomfortable with the high P/E as this earnings performance isn't likely to support such positive sentiment for long. If recent medium-term earnings trends continue, it will place shareholders' investments at significant risk and potential investors in danger of paying an excessive premium.
We don't want to rain on the parade too much, but we did also find 2 warning signs for Slater and Gordon (1 is potentially serious!) that you need to be mindful of.
You might be able to find a better investment than Slater and Gordon. If you want a selection of possible candidates, check out this free list of interesting companies that trade on a P/E below 20x (but have proven they can grow earnings).
Have feedback on this article? Concerned about the content? Get in touch with us directly. Alternatively, email editorial-team (at) simplywallst.com.
This article by Simply Wall St is general in nature. We provide commentary based on historical data and analyst forecasts only using an unbiased methodology and our articles are not intended to be financial advice. It does not constitute a recommendation to buy or sell any stock, and does not take account of your objectives, or your financial situation. We aim to bring you long-term focused analysis driven by fundamental data. Note that our analysis may not factor in the latest price-sensitive company announcements or qualitative material. Simply Wall St has no position in any stocks mentioned.
