
 Yahoo Finance
 USD/CAD Short Term Outlook with Crude Oil Prices in Focus
DailyFX.com -
Talking Points:
- USD/CAD and crude oil correlation starting to pick up again
- US Advance Goods Trade Balance and Crude Oil Inventories data in focus for the pair
- Learn good trading habits with the “Traits of successful traders” series
The USD/CAD is trading above the 1.33 handle and the pair’s correlation with crude oil prices started to pick up again as the oil rally came to a halt this last couple of days.
A quiet economic calendar shifts our focus to the Crude Oil Inventories data ahead for possible influence on the Loonie.
Against this backdrop we will form our outlook and look to find short term trading opportunities using different tools such as the Grid Sight Index (GSI) indicator.
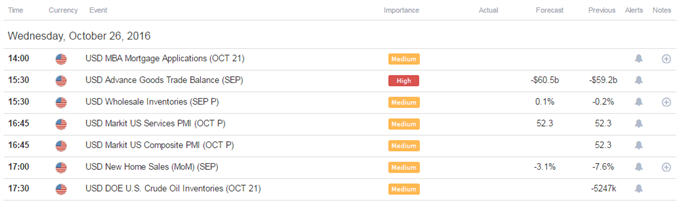
Click Here for the DailyFX Calendar
US Advance Goods Trade Balance is set to hit the wires 12:30 GMT. The print is expected to show a -60.5b deficit versus a -59.2b prior figure, but the numbers might see a limited response and mimic yesterday’s muted Consumer Confidence numbers reaction as participants could potentially hold back on directional US Dollar conviction ahead of Friday’s more significant 3Q GDP data.
This shifts our focus to the official EIA weekly Crude Oil Inventories figure. Economists are expecting a gain of 1.699 million barrels versus the prior -5.247 million contraction.
Crude Oil and USD/CAD 20-day correlation is sitting at 0.10 while 10-day correlation is at -0.51 at the time of writing, implying that correlation is starting to pick up again after the Canadian Dollar suffered from a number of negative fundamental developments, pushing the currency lower despite a run higher by crude oil prices.
Perhaps most interestingly was commentary by BOC Governor Poloz clarifying statements that initially saw the Canadian Dollar rise. When a central banker quickly clarifies statements, presumably due to a market reaction, participants might want to take note.
A dovish leaning BOC coupled with a slide in crude oil prices might just prove to be enough of a catalyst for further USD/CAD strength.
Indeed, crude oil prices are showing initial signs of a potential top, and as long as prices are contained below 50$, Canadian Dollar strength may be limited.
Adding to the mix could be potential signs of “risk off” mood into the day, which might possibly boost the US Dollar on safe haven flows.
USD/CAD Technical Levels:

Click here for the DailyFX Support & Resistance tool
We use volatility measures as a way to better fit our strategy to market conditions. 20-Day ATR readings are generally still reduced, potentially implying that longer term tech levels may still hold.
USD/CAD 30-Min Chart: October 26, 2016
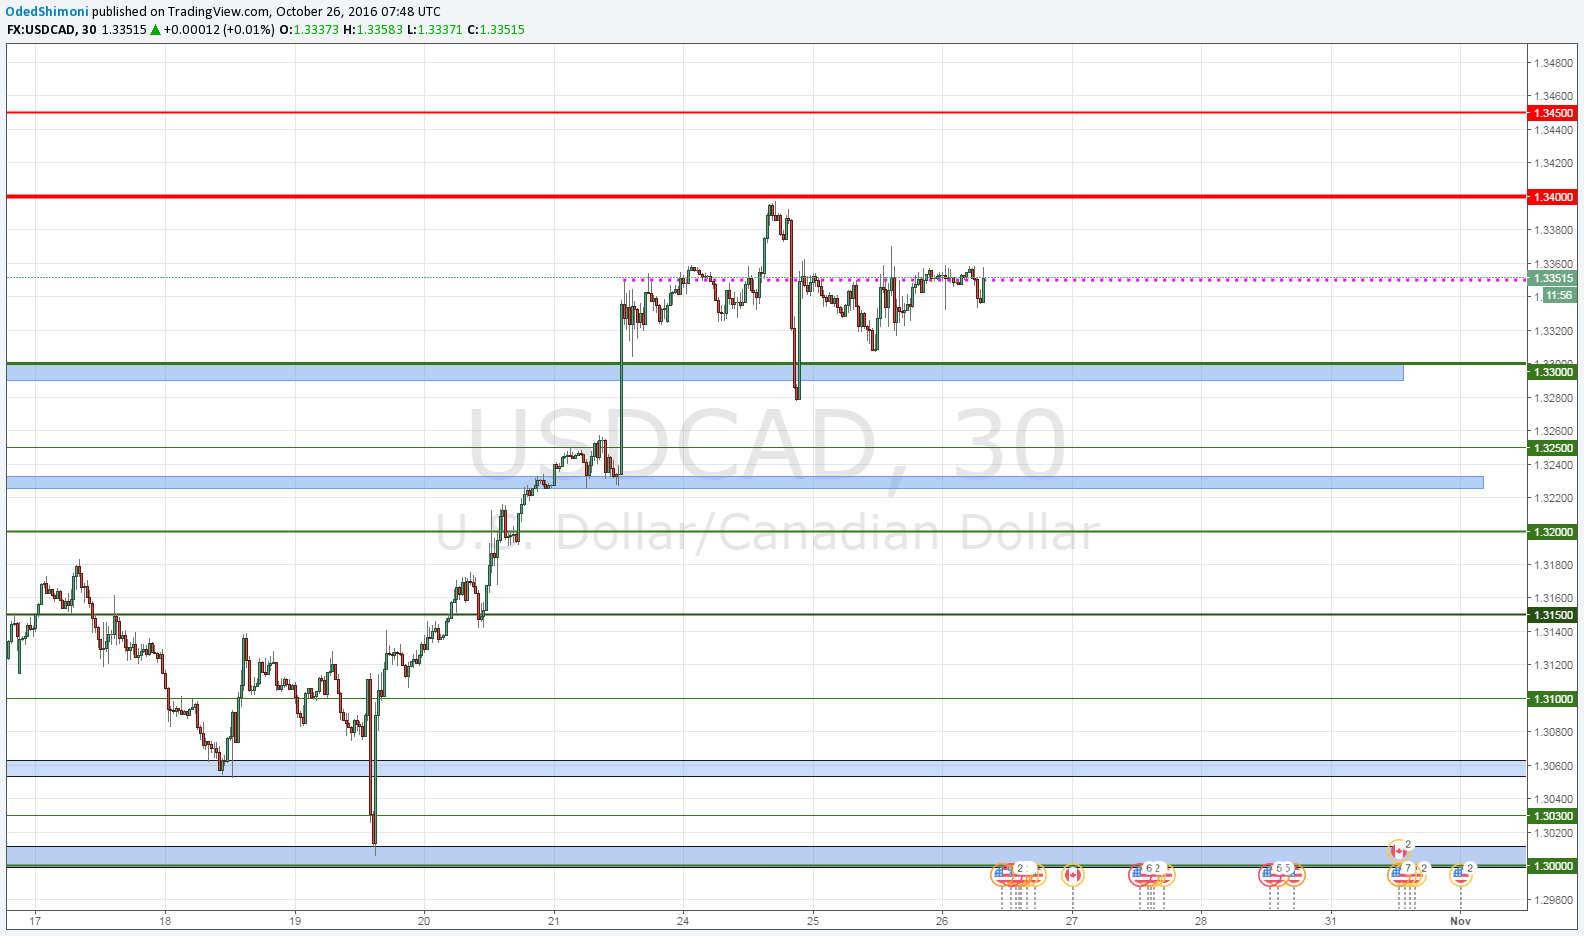
(Click to Enlarge)
The USD/CAD is trading between the 1.3300 support area and the 1.34 handle resistance, pivoting around 1.3351.
Other support levels to watch might be 1.3250, 1.3226, 1.32 and 1.3150.
The major levels of resistance in the short term seem to be 1.3400 and the 1.3450 level.
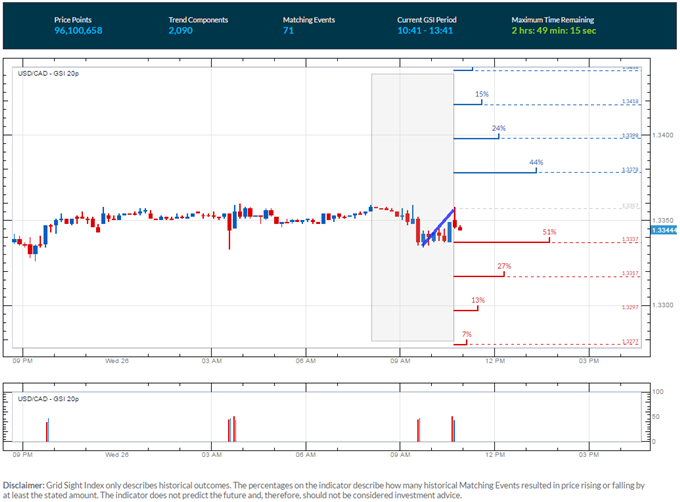
In the short term, GSI is showing similar momentum patterns moved about an even percentage of past events to either side.
The GSI indicator above calculates the distribution of past event outcomes given certain momentum patterns. By matching events in the past, GSI describes how often the price moved in a certain direction.
You can learn more about the GSI here.
We generally want to see GSI with the historical patterns significantly shifted in one direction, which alongside a pre-determined bias and other technical tools could provide a solid trading idea that offer a proper way to define risk.
--- Written by Oded Shimoni, Junior Currency Analyst for DailyFX.com
To contact Oded Shimoni, e-mail oshimoni@dailyfx.com
Follow him on Twitter at @OdedShimoni
DailyFX provides forex news and technical analysis on the trends that influence the global currency markets.
Learn forex trading with a free practice account and trading charts from FXCM.
