
 Yahoo Finance
 USD/CAD & USD/JPY - Two Peas in a Pod
DailyFX.com -
Talking Points
Striking similarities in recent price action between USD/CAD and USD/JPY
Head & Shoulders pattern break looming in USD/JPY?
Unfamiliar with Gann Square Root Relationships? Learn more about them HERE.
The rather aggressive high volume liquidation witnessed last week in USD/CAD showed what can happen when a trend move goes stale. Looking at the daily chart of USD/CAD before the recent breakdown we can’t help but notice some similarities with USD/JPY now. Both had strong primary trends leading up to weeks of consolidation. Within that consolidation/range both pairs initially broke out of a bullish triangle to briefly eeke out new multi-year highs. Following these multi-year highs both pairs sold off aggressively and had rally attempts fail well shy of those highs setting up clear potential head & shoulders topping patterns on their respective daily charts. The big differences? Duration and USD/CAD triggered its H&S pattern while USD/JPY has not. Of course these similarities in recent price action don’t mean USD/JPY will experience the same fate as USD/CAD, but it is still all rather ominous. We can only assume that the same type of frustrated longs that were forced to bail out of USD/CAD when it broke its range lows are also prevalent in USD/JPY. A move under 118.20 triggers the potential H&S pattern. Should this occur - aggressive weakness would not surprise.
To receive other reports from this author via e-mail, sign up to Kristian’s e-mail distribution list via this link.
USD/CAD & USD/JPY Daily Charts: April 24, 2015
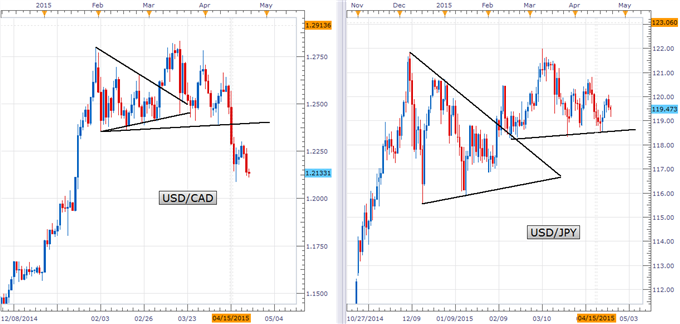
Charts Created using Marketscope – Prepared by Kristian Kerr
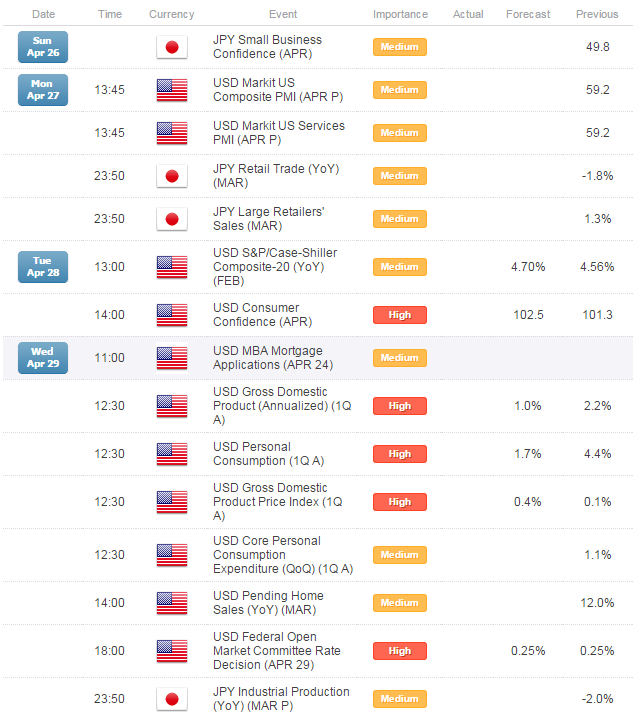
Key Event Risk in the Week Ahead:
LEVELS TO WATCH
Resistance: 120.10 (WTD high), 120.85 (MTD high)
Support: 118.40 (Gann) 118.20 (Pattern neckline)
Strategy: Sell USD/JPY
Entry: Sell USD/JPY next week on a break of 118.20
Stop: Daily close above 119.00
Target: Open
--- Written by Kristian Kerr, Senior Currency Strategist for DailyFX.com
To contact Kristian, e-mail kkerr@fxcm.com. Follow me on Twitter at@KKerrFX.
DailyFX provides forex news and technical analysis on the trends that influence the global currency markets.
Learn forex trading with a free practice account and trading charts from FXCM.
