
 Yahoo Finance
 Before you predict the next 12 months in the stock market, consider one chart
Stock market valuations are at their highest levels in years. But does that mean a crash is imminent?
“Although the median S&P 500 stock trades in the 99th historical valuation percentile, valuations are typically poor indicators of short-term returns,” Goldman Sachs’ David Kostin said.
Kostin, who expects the S&P 500 (^GSPC) to rally to 2,850 in 2018, points to the historical performance of the forward price-to-earnings (P/E) ratio. While it is probably the most popular measure of value in the stock market, alone it is a disaster when it comes to signaling what the stock market will do in the near term.

For the S&P 500, you calculate P/E by taking the price of the index and then dividing it by earnings. If the P/E is above the long-run average, then you could argue that the market is expensive. If it’s below, then you could argue the market is cheap. Importantly, prices don’t necessarily have to fall for the P/E to fall — they just have to rise at a slower pace than earnings.
Currently, the S&P 500 is trading at a forward P/E of around 18.2. According to Factset, this is significantly higher than the five-year average of 15.8 and the 10-year average of 14.2. In other words, the market looks very expensive.
But as you can see illustrated by the chaotic dot-plot above, high valuations can be followed by both significant gains or losses in the next year.
P/Es work better over time
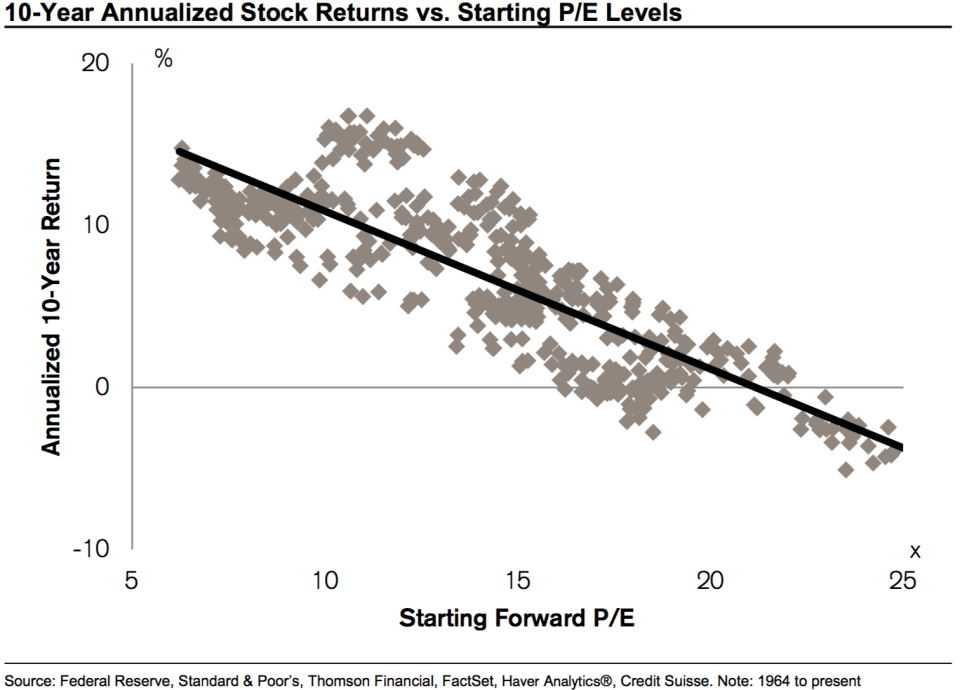
However, P/E ratios aren’t totally useless. This same dot plot takes on a different shape when you extend the time horizon. Specifically, the trend shows that over time, low valuations have historically been followed by higher returns and vice versa.
See the chart below from Credit Suisse’s Jonathan Golub (who has written about this in the past.)
“Moreover, in contrast to the ‘irrationally exuberant’ market of the late 1990s, today’s equity valuations are justified by a macro environment of extremely low rates, modest inflation, high corporate profitability and a stable economy,” Kostin said. “Nonetheless, earnings growth, rather than higher valuation, drives our 2018 forecast.”
These other variables are critical when thinking about the stock market. Experts ranging from billionaire Warren Buffett to Nobel prize winner Robert Shiller have been warning against making short-term investment decisions based on the P/E multiples alone.
So, there are two takeaways here: 1) A high valuation alone is no reason to expect a sell-off in the near-term, and 2) Investors should consider valuations in the context of other variables.
–
Sam Ro is managing editor at Yahoo Finance.
Read more:
