
 Yahoo Finance
 Ventia Services Group (ASX:VNT) Hasn't Managed To Accelerate Its Returns
What trends should we look for it we want to identify stocks that can multiply in value over the long term? Ideally, a business will show two trends; firstly a growing return on capital employed (ROCE) and secondly, an increasing amount of capital employed. If you see this, it typically means it's a company with a great business model and plenty of profitable reinvestment opportunities. So, when we ran our eye over Ventia Services Group's (ASX:VNT) trend of ROCE, we liked what we saw.
Understanding Return On Capital Employed (ROCE)
If you haven't worked with ROCE before, it measures the 'return' (pre-tax profit) a company generates from capital employed in its business. To calculate this metric for Ventia Services Group, this is the formula:
Return on Capital Employed = Earnings Before Interest and Tax (EBIT) ÷ (Total Assets - Current Liabilities)
0.19 = AU$316m ÷ (AU$2.9b - AU$1.2b) (Based on the trailing twelve months to December 2023).
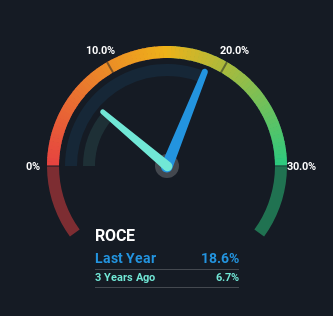
So, Ventia Services Group has an ROCE of 19%. In absolute terms, that's a satisfactory return, but compared to the Construction industry average of 14% it's much better.
View our latest analysis for Ventia Services Group
Above you can see how the current ROCE for Ventia Services Group compares to its prior returns on capital, but there's only so much you can tell from the past. If you'd like, you can check out the forecasts from the analysts covering Ventia Services Group for free.
The Trend Of ROCE
While the returns on capital are good, they haven't moved much. The company has consistently earned 19% for the last five years, and the capital employed within the business has risen 83% in that time. Since 19% is a moderate ROCE though, it's good to see a business can continue to reinvest at these decent rates of return. Stable returns in this ballpark can be unexciting, but if they can be maintained over the long run, they often provide nice rewards to shareholders.
On a side note, Ventia Services Group's current liabilities are still rather high at 42% of total assets. This can bring about some risks because the company is basically operating with a rather large reliance on its suppliers or other sorts of short-term creditors. Ideally we'd like to see this reduce as that would mean fewer obligations bearing risks.
What We Can Learn From Ventia Services Group's ROCE
In the end, Ventia Services Group has proven its ability to adequately reinvest capital at good rates of return. And the stock has followed suit returning a meaningful 48% to shareholders over the last year. So while the positive underlying trends may be accounted for by investors, we still think this stock is worth looking into further.
If you'd like to know about the risks facing Ventia Services Group, we've discovered 3 warning signs that you should be aware of.
While Ventia Services Group isn't earning the highest return, check out this free list of companies that are earning high returns on equity with solid balance sheets.
Have feedback on this article? Concerned about the content? Get in touch with us directly. Alternatively, email editorial-team (at) simplywallst.com.
This article by Simply Wall St is general in nature. We provide commentary based on historical data and analyst forecasts only using an unbiased methodology and our articles are not intended to be financial advice. It does not constitute a recommendation to buy or sell any stock, and does not take account of your objectives, or your financial situation. We aim to bring you long-term focused analysis driven by fundamental data. Note that our analysis may not factor in the latest price-sensitive company announcements or qualitative material. Simply Wall St has no position in any stocks mentioned.
