
 Yahoo Finance
 Be Wary Of Compass Minerals International (NYSE:CMP) And Its Returns On Capital
What underlying fundamental trends can indicate that a company might be in decline? When we see a declining return on capital employed (ROCE) in conjunction with a declining base of capital employed, that's often how a mature business shows signs of aging. Trends like this ultimately mean the business is reducing its investments and also earning less on what it has invested. Having said that, after a brief look, Compass Minerals International (NYSE:CMP) we aren't filled with optimism, but let's investigate further.
Understanding Return On Capital Employed (ROCE)
Just to clarify if you're unsure, ROCE is a metric for evaluating how much pre-tax income (in percentage terms) a company earns on the capital invested in its business. Analysts use this formula to calculate it for Compass Minerals International:
Return on Capital Employed = Earnings Before Interest and Tax (EBIT) ÷ (Total Assets - Current Liabilities)
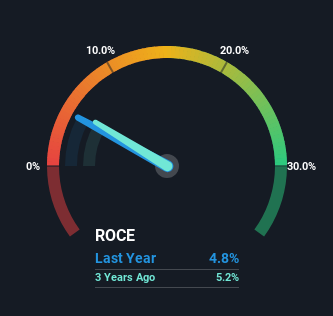
0.048 = US$76m ÷ (US$1.8b - US$204m) (Based on the trailing twelve months to December 2023).
So, Compass Minerals International has an ROCE of 4.8%. Ultimately, that's a low return and it under-performs the Metals and Mining industry average of 10%.
See our latest analysis for Compass Minerals International
In the above chart we have measured Compass Minerals International's prior ROCE against its prior performance, but the future is arguably more important. If you'd like, you can check out the forecasts from the analysts covering Compass Minerals International for free.
The Trend Of ROCE
We are a bit anxious about the trends of ROCE at Compass Minerals International. To be more specific, today's ROCE was 6.3% five years ago but has since fallen to 4.8%. In addition to that, Compass Minerals International is now employing 23% less capital than it was five years ago. The combination of lower ROCE and less capital employed can indicate that a business is likely to be facing some competitive headwinds or seeing an erosion to its moat. Typically businesses that exhibit these characteristics aren't the ones that tend to multiply over the long term, because statistically speaking, they've already gone through the growth phase of their life cycle.
The Key Takeaway
In summary, it's unfortunate that Compass Minerals International is shrinking its capital base and also generating lower returns. Investors haven't taken kindly to these developments, since the stock has declined 58% from where it was five years ago. With underlying trends that aren't great in these areas, we'd consider looking elsewhere.
On a separate note, we've found 2 warning signs for Compass Minerals International you'll probably want to know about.
While Compass Minerals International may not currently earn the highest returns, we've compiled a list of companies that currently earn more than 25% return on equity. Check out this free list here.
Have feedback on this article? Concerned about the content? Get in touch with us directly. Alternatively, email editorial-team (at) simplywallst.com.
This article by Simply Wall St is general in nature. We provide commentary based on historical data and analyst forecasts only using an unbiased methodology and our articles are not intended to be financial advice. It does not constitute a recommendation to buy or sell any stock, and does not take account of your objectives, or your financial situation. We aim to bring you long-term focused analysis driven by fundamental data. Note that our analysis may not factor in the latest price-sensitive company announcements or qualitative material. Simply Wall St has no position in any stocks mentioned.
