
 Yahoo Finance
 Should Weakness in IG Design Group plc's (LON:IGR) Stock Be Seen As A Sign That Market Will Correct The Share Price Given Decent Financials?

It is hard to get excited after looking at IG Design Group's (LON:IGR) recent performance, when its stock has declined 13% over the past three months. However, stock prices are usually driven by a company’s financials over the long term, which in this case look pretty respectable. In this article, we decided to focus on IG Design Group's ROE.
ROE or return on equity is a useful tool to assess how effectively a company can generate returns on the investment it received from its shareholders. Simply put, it is used to assess the profitability of a company in relation to its equity capital.
View our latest analysis for IG Design Group
How To Calculate Return On Equity?
The formula for return on equity is:
Return on Equity = Net Profit (from continuing operations) ÷ Shareholders' Equity
So, based on the above formula, the ROE for IG Design Group is:
4.9% = UK£15m ÷ UK£303m (Based on the trailing twelve months to March 2020).
The 'return' is the profit over the last twelve months. One way to conceptualize this is that for each £1 of shareholders' capital it has, the company made £0.05 in profit.
What Is The Relationship Between ROE And Earnings Growth?
We have already established that ROE serves as an efficient profit-generating gauge for a company's future earnings. Based on how much of its profits the company chooses to reinvest or "retain", we are then able to evaluate a company's future ability to generate profits. Assuming all else is equal, companies that have both a higher return on equity and higher profit retention are usually the ones that have a higher growth rate when compared to companies that don't have the same features.
IG Design Group's Earnings Growth And 4.9% ROE
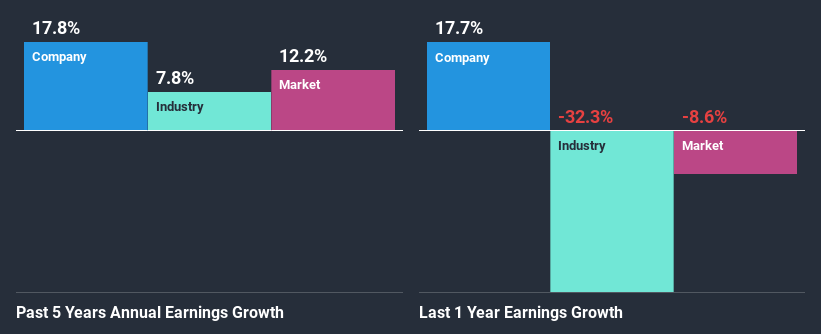
At first glance, IG Design Group's ROE doesn't look very promising. Next, when compared to the average industry ROE of 8.3%, the company's ROE leaves us feeling even less enthusiastic. Although, we can see that IG Design Group saw a modest net income growth of 18% over the past five years. We reckon that there could be other factors at play here. For instance, the company has a low payout ratio or is being managed efficiently.
We then compared IG Design Group's net income growth with the industry and we're pleased to see that the company's growth figure is higher when compared with the industry which has a growth rate of 7.8% in the same period.
Earnings growth is an important metric to consider when valuing a stock. What investors need to determine next is if the expected earnings growth, or the lack of it, is already built into the share price. Doing so will help them establish if the stock's future looks promising or ominous. Has the market priced in the future outlook for IGR? You can find out in our latest intrinsic value infographic research report.
Is IG Design Group Making Efficient Use Of Its Profits?
With a three-year median payout ratio of 29% (implying that the company retains 71% of its profits), it seems that IG Design Group is reinvesting efficiently in a way that it sees respectable amount growth in its earnings and pays a dividend that's well covered.
Besides, IG Design Group has been paying dividends over a period of five years. This shows that the company is committed to sharing profits with its shareholders. Our latest analyst data shows that the future payout ratio of the company over the next three years is expected to be approximately 35%. Still, forecasts suggest that IG Design Group's future ROE will rise to 7.9% even though the the company's payout ratio is not expected to change by much.
Conclusion
On the whole, we do feel that IG Design Group has some positive attributes. Despite its low rate of return, the fact that the company reinvests a very high portion of its profits into its business, no doubt contributed to its high earnings growth. On studying current analyst estimates, we found that analysts expect the company to continue its recent growth streak. To know more about the company's future earnings growth forecasts take a look at this free report on analyst forecasts for the company to find out more.
This article by Simply Wall St is general in nature. It does not constitute a recommendation to buy or sell any stock, and does not take account of your objectives, or your financial situation. We aim to bring you long-term focused analysis driven by fundamental data. Note that our analysis may not factor in the latest price-sensitive company announcements or qualitative material. Simply Wall St has no position in any stocks mentioned.
Have feedback on this article? Concerned about the content? Get in touch with us directly. Alternatively, email editorial-team@simplywallst.com.
