
 Yahoo Finance
 Why You Should Care About Revolve Group's (NYSE:RVLV) Strong Returns On Capital
Finding a business that has the potential to grow substantially is not easy, but it is possible if we look at a few key financial metrics. Typically, we'll want to notice a trend of growing return on capital employed (ROCE) and alongside that, an expanding base of capital employed. This shows us that it's a compounding machine, able to continually reinvest its earnings back into the business and generate higher returns. Ergo, when we looked at the ROCE trends at Revolve Group (NYSE:RVLV), we liked what we saw.
What is Return On Capital Employed (ROCE)?
Just to clarify if you're unsure, ROCE is a metric for evaluating how much pre-tax income (in percentage terms) a company earns on the capital invested in its business. Analysts use this formula to calculate it for Revolve Group:
Return on Capital Employed = Earnings Before Interest and Tax (EBIT) ÷ (Total Assets - Current Liabilities)
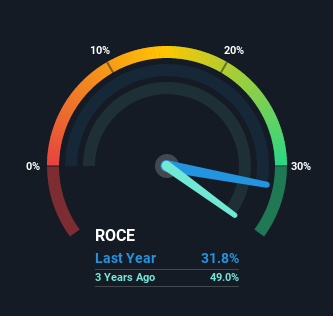
0.32 = US$90m ÷ (US$449m - US$166m) (Based on the trailing twelve months to September 2021).
Thus, Revolve Group has an ROCE of 32%. That's a fantastic return and not only that, it outpaces the average of 12% earned by companies in a similar industry.
View our latest analysis for Revolve Group
Above you can see how the current ROCE for Revolve Group compares to its prior returns on capital, but there's only so much you can tell from the past. If you'd like, you can check out the forecasts from the analysts covering Revolve Group here for free.
So How Is Revolve Group's ROCE Trending?
In terms of Revolve Group's history of ROCE, it's quite impressive. The company has employed 509% more capital in the last four years, and the returns on that capital have remained stable at 32%. Returns like this are the envy of most businesses and given it has repeatedly reinvested at these rates, that's even better. You'll see this when looking at well operated businesses or favorable business models.
One more thing to note, even though ROCE has remained relatively flat over the last four years, the reduction in current liabilities to 37% of total assets, is good to see from a business owner's perspective. This can eliminate some of the risks inherent in the operations because the business has less outstanding obligations to their suppliers and or short-term creditors than they did previously.
In Conclusion...
In short, we'd argue Revolve Group has the makings of a multi-bagger since its been able to compound its capital at very profitable rates of return. And the stock has done incredibly well with a 234% return over the last year, so long term investors are no doubt ecstatic with that result. So while investors seem to be recognizing these promising trends, we still believe the stock deserves further research.
One final note, you should learn about the 4 warning signs we've spotted with Revolve Group (including 1 which makes us a bit uncomfortable) .
Revolve Group is not the only stock earning high returns. If you'd like to see more, check out our free list of companies earning high returns on equity with solid fundamentals.
This article by Simply Wall St is general in nature. We provide commentary based on historical data and analyst forecasts only using an unbiased methodology and our articles are not intended to be financial advice. It does not constitute a recommendation to buy or sell any stock, and does not take account of your objectives, or your financial situation. We aim to bring you long-term focused analysis driven by fundamental data. Note that our analysis may not factor in the latest price-sensitive company announcements or qualitative material. Simply Wall St has no position in any stocks mentioned.
Have feedback on this article? Concerned about the content? Get in touch with us directly. Alternatively, email editorial-team (at) simplywallst.com.
