
 Yahoo Finance
 Why is the Market Unimpressed with Bank Earnings?


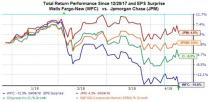


The market appears to be painting JPMorgan (JPM) with the same brush as Wells Fargo (WFC) and Citigroup (C) after their quarterly releases, but the fact is that JPMorgan’s report represented all around strength and offers useful read-throughs for what to expect from pure-play investment banks, trust banks and regional operators in the coming days.
It isn’t hard to appreciate the market’s negative reaction to the Wells and Citi reports, but the post-release weakness in JPMorgan shares is likely nothing more than a sell-the-news type of mindset. There is likely a comparability ground for the market’s lack of appreciation for these results as well. Two new accounting rules took effect this quarter, one dealing with revenue recognition on the asset management side and the other dealing with the valuation of ‘hard-to-price’ securities on the balance sheets. The earnings releases specify the impact of these rule changes, but they add to the ‘noise’ around these results.
Wells Fargo didn’t seem to benefit much from higher interest rates as rival JPMorgan did, likely indicating that the beleaguered bank had the wrong type of interest rate hedges in place. The bank is in the process of concluding a regulatory settlement that will require a restatement of today’s results in the coming days, but management wasn’t able to shed any more light on that issue beyond indicating that more details should be available in the 10Q. As such, it’s hard to read too much into Wells’ Q1 report as it will undergo a restatement in the coming days
We recently made a contrarian call on Wells by adding it to the Zacks Focus List, our core thesis being that worst was already priced in the stock and the market will slowly be coming around to appreciating this fact. The internals of the Wells report indicate that the estimate revisions trend for the current and coming quarters will likely be negative, in contrast to what can reasonably be expected for JPMorgan and Citi, which will keep the stock under pressure. This means that our Focus List call on Wells may have been premature, with the stock’s underperformance relative to its peers likely to persist a lot longer than we envisaged.
The chart below shows the year-to-date performance comparison Citi, JPMorgan, Wells and the S&P 500 index.

Wells’ net interest margin, the difference between what it pays depositors and what it charges borrowers, was flat from the preceding quarter and down from the year-earlier level. Growth in the bank’s loan portfolio and expenses also compare unfavorably with its peers. Wells’ loan portfolio was down from the year-earlier level while the same at Citi and JPMorgan were up +7% and 8%, respectively.
Citi’s results failed to impress as well, with the bank’s trading business, particularly the fixed income desk, failed to fully capitalize on the all-around volatility in Q1. Unlike JPMorgan’s +8% revenue growth in the fixed income, currencies and commodities or FICC business, Citi’s FICC revenue was down -7% in Q1.
Finance Sector Scorecard (as of Friday, April 13th)
We now have Q1 results from 5 of the 98 Finance sector companies in the S&P 500 index. Keep in mind however that these 5 companies account for 23.7% of the sector’s total market capitalization in the index.
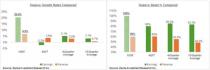
Total earnings for these 5 Finance companies are up +20.4% from the same period last year on +6.9% higher revenue growth, with 100% beating EPS estimates and 60% beating revenue estimates. The comparison charts below put the results thus far in a historical context.
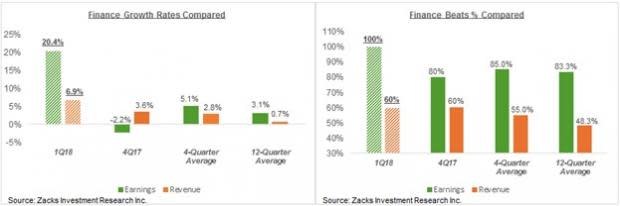
As you can see in the chart above, the sector’s growth picture is materially tracking above what we have been seeing in recent years, reflecting the combined effect of tax cuts, higher interest rates and more ‘normal’ capital markets activity. The right-hand side chart shows that earnings surprises are very numerous, but keep in mind that we are talking about 5 earnings reports at this stage.
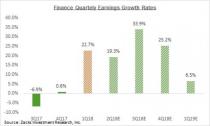
For the quarter as a whole, total Finance sector earnings are expected to be up +22.7% from the same period last year on +4.7% higher revenues. This would follow +0.6% earnings growth in 2017 Q4 on +4% higher revenues.
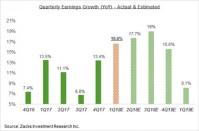
The sector’s earnings growth momentum is expected to continue in the coming quarters as well, as the chart below shows.

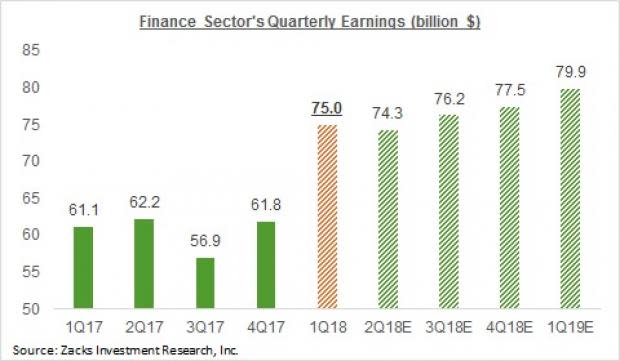
Please note that the sector’s strong growth in Q1 and beyond isn’t a function of easy comparisons, but actual growth. You can see this in the dollar value of total sector earnings in the chart below.
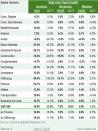
The table below shows the sector’s Q1 earnings growth expectations at the medium-industry level contrasted with estimates for the following four quarters and actual results for the preceding four periods.

Please note that the Major Banks industry, of which JPMorgan, Bank of America and others are part, accounts for roughly 45% of the sector’s total earnings (insurance is the second biggest earnings contributor, accounting for about 25% of the total).
Driving this improved earnings picture for the banks and other finance companies is the combination of lower taxes and higher interest rates.
Expectations for 2018 Q1 As a Whole
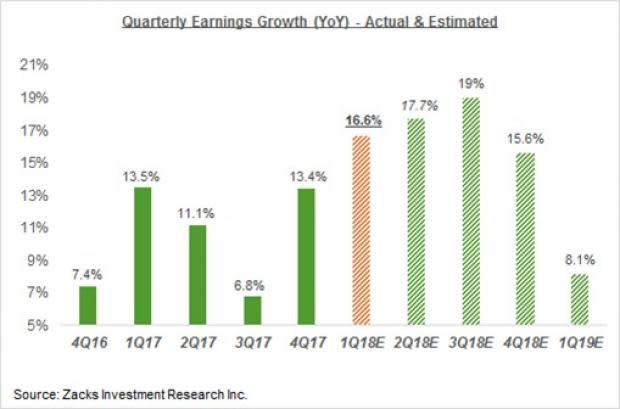
The strong momentum we saw in the preceding earnings season is expected to continue this reporting cycle as well, with total earnings for the S&P 500 index expected to be up +16.6% from the same period last year on +7.5% higher revenues. This would follow the +13.4% earnings growth on +8.6% revenue growth in the 2017 Q4 earnings season, the best quarterly performance in more than 6 years.
There were two aspects of the preceding earning season that really stood out and put that reporting cycle in a category of its own; we will be looking to what extent these two aspect s get repeated this earnings season. These two standout features of the 2017 Q4 earnings season were the very strong momentum on the revenue front and impressive turnaround on the estimate revisions front.
The revenue momentum likely reflected a combination of the synchronized global growth environment and a favorable foreign exchange backdrop. With both of those factors still very much in play in Q1 as well, we can reasonably expect to see the revenue momentum trend continue this earnings season as well.
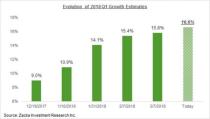
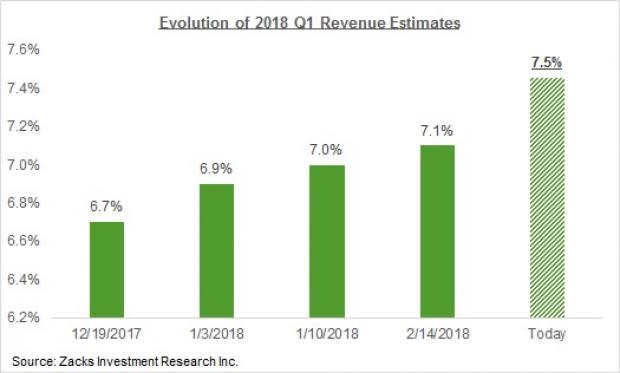
The story about trends in 2018 Q1 estimate revisions is better told by the chart below.

What this chart shows is that earnings growth expectations for 2018 Q1 moved up significantly since mid-December 2017. This represented a major trend shift relative to what we have been seeing over the last many years when estimates would actually be moving in the opposite direction. To be fair, the revisions trend had stabilized in the preceding quarters as well, with estimates for 2017 Q4 essentially remaining unchanged in the three months ahead of the start of that reporting cycle.
A big driver of these positive revisions is obviously the direct impact of the tax cuts, but that isn’t the only reason, as you can see in the revisions trend for revenues in the chart below.
We will be keeping a close eye on how estimates for 2018 Q2 evolve as companies report Q1 results and share their outlook for Q2 and beyond. Estimates for Q2 went up as well, as they did for the following quarters, when the same was happening to 2018 Q1 estimates. As of today, total Q2 earnings for the S&P 500 index are expected to be up +17.7% from the same period the year before on +7.2% higher revenues.
The chart below shows 2018 Q1 earnings growth expectations contrasted with what is expected in the following three quarters and actual results in the preceding 5 quarters. As you can see in the chart below, the growth pace is expected to accelerate in Q2 and continue in the following quarters.
As you can imagine, expectations for full-year 2018 are for an impressive showing, with total earnings for the S&P 500 index expected to be +17.8% from the year-earlier level on +5.2% higher revenues. If achieved, this will be the highest annual growth pace for the index since 2010.
The table below shows the summary picture for 2018 Q1, contrasted with what was actually achieved in the preceding period.
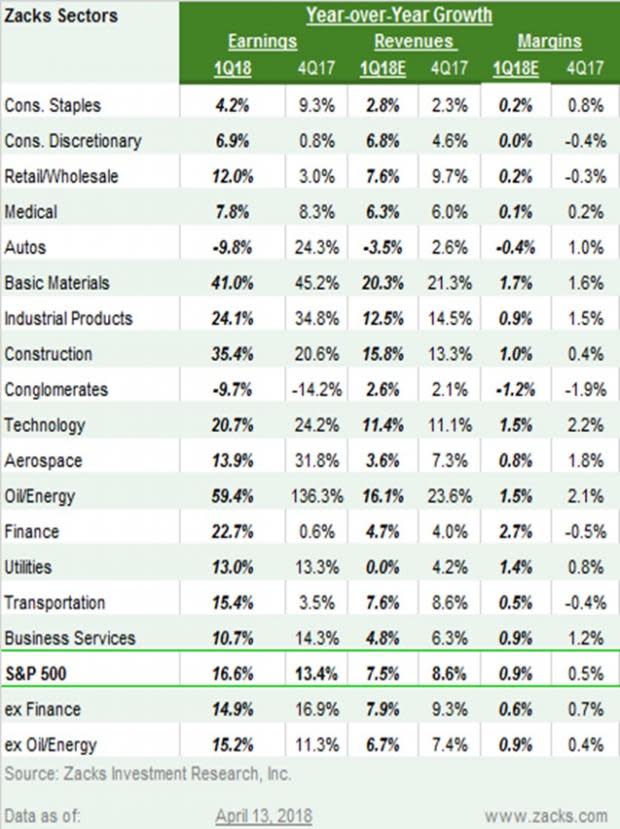
Standout Sectors
As you can see, the Energy sector remains a big growth contributor in Q1, with total earnings for the sector expected to be up +59.4% from the year-earlier period on +16.1% higher revenues. But growth for the quarter would still be in double-digits even on an ex-Energy basis (last row in the table above).
What is driving the strong Q1 growth isn’t the Energy sector, but rather the breadth of growth across all sectors, with double-digit earnings growth for 11 out of the 16 Zacks sectors, including Technology and Finance.
For the Technology sector, total Q1 earnings are expected to be up +20.7% on +11.4% higher revenues, which would follow the sector’s impressive +24.2% earnings growth on +11.1% higher revenue growth.
The Finance sector, which sat out the preceding quarter with an essentially flat showing, total Q1 earnings are expected to be up +22.7% from the same period last year on +4.7% higher revenues.
Driving the Finance sector’s strong growth in Q1 and beyond is the combined effect of tax cuts, higher interest rates and an improved domestic growth environment. Finance sector’s earnings were only up +1.2% in full-year 2017 and in low single digits in the three years prior to that, but are on expected to be up an impressive +25.1% in full-year 2018.
The Technology sector, on the other hand, has already been on stronger ground, with full-year 2017 earnings for the sector up +15.8% and expected to be up +17.3% in 2018. The enterprise spending environment was expected to improve this year even before the tax cuts, with the tax windfall expected to give a much needed boost to those trends. On top of these we have the existing secular trends in cloud computing, artificial intelligence and big data that are expected to remain growth areas in the space.
Please note that Technology and Finance aren’t just any two sectors out of the 16 in the S&P 500 index; these two sectors combined are the twin pillars of index’s total profitability, bringing in more than 40% of the index’s total earnings this year. The Energy sector’s outlook has improved, but the sector simply lacks the heft of these two. The Energy sector is expected to bring in about 5% of the index’s total earnings this year.
Reporting Calendar
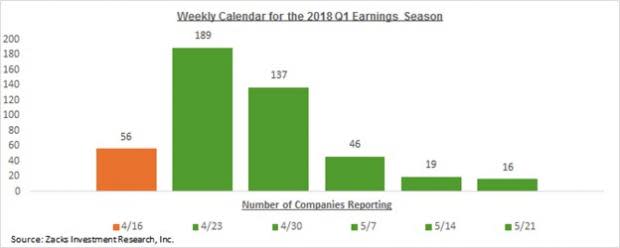
As you can see in the chart above, the reporting cycle is ramping up with more than 150 companies reporting results, including 56 S&P 500 members. While the bulk of this week’s reports are dominated by the Finance sector, we have a number of leading players from other sectors reporting results already. The major non-financial reports on deck to report results this week include Netflix (NFLX) on Monday, IBM (IBM) on Tuesday, and Schlumberger (SLB) and GE (GE) on Friday.
Note: Sheraz Mian manages the Zacks equity research department. He is an acknowledged earnings expert whose commentaries and analyses appear on Zacks.com and in the print and electronic media. His weekly earnings related articles include Earnings Trends and Earnings Preview. He manages the Zacks Top 10 and Focus List portfolios and writes the Weekly Market Analysis article for Zacks Premium subscribers.
Will You Make a Fortune on the Shift to Electric Cars?
Here's another stock idea to consider. Much like petroleum 150 years ago, lithium power may soon shake the world, creating millionaires and reshaping geo-politics. Soon electric vehicles (EVs) may be cheaper than gas guzzlers. Some are already reaching 265 miles on a single charge.
With battery prices plummeting and charging stations set to multiply, one company stands out as the #1 stock to buy according to Zacks research.
It's not the one you think.
See This Ticker Free >>
Here is a list of the 153 companies including 56 S&P 500 and reporting this week.
Company | Ticker | Current Qtr | Year-Ago Qtr | Last EPS Surprise % | Report Day | Time |
M&T BANK CORP | MTB | 2.74 | 2.15 | 10.83% | Monday | BTO |
BANK OF AMER CP | BAC | 0.59 | 0.41 | 6.82% | Monday | BTO |
NETFLIX INC | NFLX | 0.63 | 0.4 | 0.00% | Monday | AMC |
CELANESE CP-A | CE | 2.33 | 1.81 | 6.45% | Monday | AMC |
WINTRUST FINL | WTFC | 1.29 | 1 | 2.63% | Monday | AMC |
PINNACLE FIN PT | PNFP | 1.09 | 0.83 | 0.00% | Monday | AMC |
FIRST DEFIANCE | FDEF | 0.98 | 0.81 | 5.62% | Monday | AMC |
DESTINY MEDIA | DSNY | N/A | 0 | N/A | Monday | AMC |
LAKELAND INDS | LAKE | 0.19 | 0.13 | 21.05% | Monday | AMC |
SERVISFIRST BCS | SFBS | 0.58 | 0.42 | -6.25% | Monday | AMC |
Charles Schwab | SCHW | 0.54 | 0.39 | -0.36% | Monday | N/A |
UNITEDHEALTH GP | UNH | 2.92 | 2.37 | 3.60% | Tuesday | BTO |
JOHNSON & JOHNS | JNJ | 2.01 | 1.83 | 1.16% | Tuesday | BTO |
COMERICA INC | CMA | 1.56 | 1.02 | 2.40% | Tuesday | BTO |
PROLOGIS INC | PLD | 0.74 | 0.63 | 1.52% | Tuesday | BTO |
NORTHERN TRUST | NTRS | 1.42 | 1.09 | 3.85% | Tuesday | BTO |
PROGRESSIVE COR | PGR | 1.19 | 0.67 | 2.60% | Tuesday | BTO |
GOLDMAN SACHS | GS | 5.67 | 5.15 | 15.92% | Tuesday | BTO |
OMNICOM GRP | OMC | 1.05 | 0.97 | 0.65% | Tuesday | BTO |
MELLANOX TECH | MLNX | 0.52 | 0 | 37.14% | Tuesday | BTO |
MERCANTILE BANK | MBWM | 0.56 | 0.46 | -4.00% | Tuesday | BTO |
LAM RESEARCH | LRCX | 4.36 | 2.8 | 17.62% | Tuesday | AMC |
CSX CORP | CSX | 0.66 | 0.51 | 14.29% | Tuesday | AMC |
INTL BUS MACH | IBM | 2.39 | 2.38 | 0.19% | Tuesday | AMC |
UNITED CONT HLD | UAL | 0.25 | 0.4 | 4.48% | Tuesday | AMC |
INTUITIVE SURG | ISRG | 1.65 | 1.56 | 6.15% | Tuesday | AMC |
HANCOCK HLDG CO | HBHC | 0.9 | 0.63 | 3.61% | Tuesday | AMC |
FULTON FINL | FULT | 0.29 | 0.25 | 0.00% | Tuesday | AMC |
HOPE BANCORP | HOPE | 0.38 | 0.28 | 3.23% | Tuesday | AMC |
LEGACY TX FINL | LTXB | 0.72 | 0.37 | -3.23% | Tuesday | AMC |
BADGER METER | BMI | 0.39 | 0.3 | 8.70% | Tuesday | AMC |
ADTRAN INC | ADTN | -0.19 | 0.15 | 225.00% | Tuesday | AMC |
INTERACTIVE BRK | IBKR | 0.56 | 0.34 | 10.26% | Tuesday | AMC |
UNITED FIN BCP | UBNK | 0.28 | 0.27 | -17.24% | Tuesday | AMC |
UTD COMM FIN CP | UCFC | 0.17 | 0.1 | 6.67% | Tuesday | AMC |
WESBANCO INC | WSBC | 0.7 | 0.6 | 8.20% | Tuesday | AMC |
CONSOL TOMOKA | CTO | 1.25 | 2.27 | -27.66% | Tuesday | AMC |
ABBOTT LABS | ABT | 0.58 | 0.48 | 1.37% | Wednesday | BTO |
US BANCORP | USB | 0.94 | 0.82 | 1.15% | Wednesday | BTO |
TEXTRON INC | TXT | 0.49 | 0.46 | -3.90% | Wednesday | BTO |
MORGAN STANLEY | MS | 1.28 | 1 | 9.09% | Wednesday | BTO |
QCR HLDGS INC | QCRH | 0.71 | 0.68 | 6.06% | Wednesday | BTO |
ASML HOLDING NV | ASML | 1.38 | 1.12 | 41.60% | Wednesday | BTO |
FREDS INC | FRED | N/A | -0.11 | -180.00% | Wednesday | BTO |
MGIC INVSTMT CP | MTG | 0.36 | 0.31 | 59.26% | Wednesday | BTO |
SL GREEN REALTY | SLG | 1.64 | 1.57 | 0.00% | Wednesday | AMC |
UTD RENTALS INC | URI | 2.43 | 1.64 | 0.00% | Wednesday | AMC |
AMER EXPRESS CO | AXP | 1.73 | 1.34 | 2.60% | Wednesday | AMC |
TORCHMARK CORP | TMK | 1.46 | 1.15 | 0.81% | Wednesday | AMC |
CROWN CASTLE | CCI | 1.26 | 1.24 | 23.76% | Wednesday | AMC |
STEEL DYNAMICS | STLD | 0.91 | 0.82 | 10.20% | Wednesday | AMC |
CROWN HLDGS INC | CCK | 0.8 | 0.72 | 0.00% | Wednesday | AMC |
CVB FINL | CVBF | 0.31 | 0.26 | 3.70% | Wednesday | AMC |
BOSTON PRIV FIN | BPFH | 0.22 | 0.15 | -4.35% | Wednesday | AMC |
CATHAY GENL BCP | CATY | 0.79 | 0.61 | -3.17% | Wednesday | AMC |
GREAT SOUTH BCP | GSBC | 0.87 | 0.81 | 8.54% | Wednesday | AMC |
UNIVL FST PRODS | UFPI | 0.42 | 0.34 | 14.69% | Wednesday | AMC |
CDN PAC RLWY | CP | 2.16 | 1.9 | -1.17% | Wednesday | AMC |
TEXAS CAP BCSHS | TCBI | 1.37 | 0.8 | 2.59% | Wednesday | AMC |
SLEEP NUMBER CP | SNBR | 0.56 | 0.56 | 65.00% | Wednesday | AMC |
UMPQUA HLDGS CP | UMPQ | 0.28 | 0.21 | 6.90% | Wednesday | AMC |
ALCOA CORP | AA | 0.64 | 0.63 | -15.45% | Wednesday | AMC |
PTC INC | PTC | 0.16 | 0.12 | 17.65% | Wednesday | AMC |
PIER 1 IMPORTS | PIR | 0.19 | 0.34 | -25.00% | Wednesday | AMC |
VALMONT INDS | VMI | 1.8 | 1.68 | -0.60% | Wednesday | AMC |
TRIUMPH BANCORP | TBK | 0.56 | 0.02 | 17.39% | Wednesday | AMC |
EAGLE BCP INC | EGBN | 1.03 | 0.77 | -1.12% | Wednesday | AMC |
FIRST CT BANCRP | FBNK | 0.41 | 0.32 | -2.86% | Wednesday | AMC |
BANCORPSOUTH BK | BXS | 0.5 | 0.39 | 2.44% | Wednesday | AMC |
COHEN&STRS INC | CNS | 0.61 | 0.47 | 0.00% | Wednesday | AMC |
RLI CORP | RLI | 0.5 | 0.44 | 6.25% | Wednesday | AMC |
TRISTATE CP HLD | TSC | 0.34 | 0.26 | 3.03% | Wednesday | AMC |
NUCOR CORP | NUE | 1.1 | 1.11 | 18.18% | Thursday | BTO |
GRAINGER W W | GWW | 3.37 | 2.88 | 34.86% | Thursday | BTO |
PENTAIR PLC | PNR | 0.83 | 0.65 | -1.06% | Thursday | BTO |
DANAHER CORP | DHR | 0.94 | 0.85 | 2.59% | Thursday | BTO |
PEOPLES UTD FIN | PBCT | 0.3 | 0.22 | 14.81% | Thursday | BTO |
SNAP-ON INC | SNA | 2.74 | 2.39 | 1.13% | Thursday | BTO |
BB&T CORP | BBT | 0.92 | 0.74 | 5.00% | Thursday | BTO |
KEYCORP NEW | KEY | 0.38 | 0.32 | 0.00% | Thursday | BTO |
QUEST DIAGNOSTC | DGX | 1.53 | 1.33 | 0.73% | Thursday | BTO |
BANK OF NY MELL | BK | 0.97 | 0.8 | 0.00% | Thursday | BTO |
GENUINE PARTS | GPC | 1.32 | 1.08 | 0.90% | Thursday | BTO |
PPG INDS INC | PPG | 1.41 | 1.35 | 0.85% | Thursday | BTO |
PHILIP MORRIS | PM | 0.87 | 0.98 | -3.68% | Thursday | BTO |
ALLIANCE DATA | ADS | 4.21 | 3.64 | 29.24% | Thursday | BTO |
COMP TASK | CTG | 0.06 | 0.05 | 0.00% | Thursday | BTO |
TAIWAN SEMI-ADR | TSM | 0.6 | 0.54 | 1.59% | Thursday | BTO |
EAST WEST BC | EWBC | 1 | 0.88 | -5.43% | Thursday | BTO |
WABCO HOLDINGS | WBC | 1.83 | 1.47 | 11.11% | Thursday | BTO |
WEBSTER FINL CP | WBS | 0.79 | 0.62 | -2.99% | Thursday | BTO |
SYNTEL INC | SYNT | 0.44 | 0.46 | 58.97% | Thursday | BTO |
SONOCO PRODUCTS | SON | 0.72 | 0.59 | -1.37% | Thursday | BTO |
BLACKSTONE GRP | BX | 0.76 | 0.82 | 1.43% | Thursday | BTO |
GATX CORP | GATX | 1.17 | 1.44 | -5.56% | Thursday | BTO |
CHART INDUSTRIE | GTLS | 0.19 | 0.01 | 43.75% | Thursday | BTO |
HOME BANCSHARES | HOMB | 0.41 | 0.33 | 2.94% | Thursday | BTO |
S&T BANCORP INC | STBA | 0.7 | 0.52 | 3.17% | Thursday | BTO |
SANDY SPRING | SASR | 0.75 | 0.63 | 1.59% | Thursday | BTO |
NOVARTIS AG-ADR | NVS | 1.33 | 1.13 | 3.45% | Thursday | BTO |
MEDIDATA SOLUTN | MDSO | 0.18 | 0.2 | 50.00% | Thursday | BTO |
TILE SHOP HLDGS | TTS | 0.08 | 0.16 | -200.00% | Thursday | BTO |
ABB LTD-ADR | ABB | 0.31 | 0.28 | 32.00% | Thursday | BTO |
LAWSON PRODUCTS | LAWS | 0.16 | 0.09 | -112.50% | Thursday | BTO |
E TRADE FINL CP | ETFC | 0.78 | 0.48 | 3.23% | Thursday | AMC |
LIMELIGHT NETWK | LLNW | -0.01 | -0.01 | 100.00% | Thursday | AMC |
EASTGROUP PPTYS | EGP | 1.1 | 0.99 | 3.64% | Thursday | AMC |
IBERIABANK CORP | IBKC | 1.42 | 1.02 | 5.56% | Thursday | AMC |
MARTEN TRANS | MRTN | 0.19 | 0.15 | 0.00% | Thursday | AMC |
EQUITY BANCSHRS | EQBK | N/A | 0.45 | -4.08% | Thursday | AMC |
ASSOC BANC CORP | ASB | 0.41 | 0.35 | 7.89% | Thursday | AMC |
WERNER ENTRPRS | WERN | 0.37 | 0.22 | 7.69% | Thursday | AMC |
ATLASSIAN CP-A | TEAM | -0.03 | -0.05 | -133.33% | Thursday | AMC |
WESTERN ALLIANC | WAL | 0.93 | 0.7 | 3.66% | Thursday | AMC |
GLACIER BANCORP | GBCI | 0.53 | 0.41 | -4.35% | Thursday | AMC |
FIRST FIN BC-OH | FFBC | 0.46 | 0.39 | 9.76% | Thursday | AMC |
PREFERRED BANK | PFBC | 1.07 | 0.71 | 8.89% | Thursday | AMC |
EXPONENT INC | EXPO | 0.62 | 0.39 | 14.63% | Thursday | AMC |
ROGERS COMM CLB | RCI | 0.62 | 0.46 | 1.47% | Thursday | AMC |
CHEMED CORP | CHE | 2.37 | 1.82 | 10.94% | Thursday | AMC |
CHEROKEE INC | CHKE | 0.07 | 0.15 | -171.43% | Thursday | AMC |
DAVIDSTEA INC | DTEA | 0.23 | 0.29 | 6.67% | Thursday | AMC |
INDEP BK MASS | INDB | 1.03 | 0.78 | 1.14% | Thursday | AMC |
SB FINANCIAL GP | SBFG | 0.31 | 0.31 | N/A | Thursday | AMC |
BRANDYWINE RT | BDN | 0.32 | 0.32 | -3.03% | Thursday | AMC |
CLEARWATER PAPR | CLW | 0.62 | 0.7 | 8.75% | Thursday | AMC |
PZENA INVESTMNT | PZN | 0.19 | 0.12 | 11.76% | Thursday | AMC |
ROPER TECHNOLGS | ROP | 2.49 | 2.11 | 3.45% | Friday | BTO |
REGIONS FINL CP | RF | 0.31 | 0.23 | 3.85% | Friday | BTO |
SCHLUMBERGER LT | SLB | 0.38 | 0.25 | 9.09% | Friday | BTO |
SUNTRUST BKS | STI | 1.11 | 0.87 | 3.81% | Friday | BTO |
SYNCHRONY FIN | SYF | 0.75 | 0.61 | 11.11% | Friday | BTO |
CITIZENS FIN GP | CFG | 0.76 | 0.61 | 5.97% | Friday | BTO |
STATE ST CORP | STT | 1.58 | 1.21 | 7.02% | Friday | BTO |
HONEYWELL INTL | HON | 1.89 | 1.66 | 0.54% | Friday | BTO |
KANSAS CITY SOU | KSU | 1.37 | 1.17 | 1.47% | Friday | BTO |
WASTE MGMT-NEW | WM | 0.82 | 0.66 | 2.41% | Friday | BTO |
BAKER HUGHES GE | BHGE | 0.07 | -0.04 | 7.14% | Friday | BTO |
PROCTER & GAMBL | PG | 0.99 | 0.96 | 3.48% | Friday | BTO |
STANLEY B&D INC | SWK | 1.35 | 1.29 | 1.87% | Friday | BTO |
GENL ELECTRIC | GE | 0.11 | 0.21 | -3.57% | Friday | BTO |
TRANSUNION | TRU | 0.46 | 0.38 | 0.00% | Friday | BTO |
STEVEN MADDEN | SHOO | 0.5 | 0.47 | 2.13% | Friday | BTO |
CLEVELAND-CLIFF | CLF | -0.19 | -0.11 | 73.33% | Friday | BTO |
GENTEX CORP | GNTX | 0.4 | 0.33 | 3.13% | Friday | BTO |
MANPOWER INC WI | MAN | 1.65 | 1.09 | 3.41% | Friday | BTO |
MOBILE MINI INC | MINI | 0.34 | 0.25 | 13.89% | Friday | BTO |
AMERIS BANCORP | ABCB | 0.78 | 0.6 | 0.00% | Friday | BTO |
ERICSSON LM ADR | ERIC | -0.03 | -0.27 | -450.00% | Friday | BTO |
OFG BANCORP | OFG | 0.27 | 0.26 | 311.11% | Friday | BTO |
BANCO LATINOAME | BLX | 0.58 | 0.6 | -5.45% | Friday | BTO |
CONTROLADORA VL | VLRS | -0.15 | -0.71 | 27.27% | Friday | BTO |
FIRSTENERGY CP | FE | 0.7 | 0.77 | 2.90% | Friday | AMC |
Want the latest recommendations from Zacks Investment Research? Today, you can download 7 Best Stocks for the Next 30 Days. Click to get this free report
Wells Fargo & Company (WFC) : Free Stock Analysis Report
Schlumberger Limited (SLB) : Free Stock Analysis Report
Netflix, Inc. (NFLX) : Free Stock Analysis Report
JPMorgan Chase & Co. (JPM) : Free Stock Analysis Report
International Business Machines Corporation (IBM) : Free Stock Analysis Report
General Electric Company (GE) : Free Stock Analysis Report
Citigroup Inc. (C) : Free Stock Analysis Report
To read this article on Zacks.com click here.
Zacks Investment Research
