
 Yahoo Finance
 Why We Like The Returns At Dynacor Gold Mines (TSE:DNG)
If we want to find a potential multi-bagger, often there are underlying trends that can provide clues. In a perfect world, we'd like to see a company investing more capital into its business and ideally the returns earned from that capital are also increasing. Ultimately, this demonstrates that it's a business that is reinvesting profits at increasing rates of return. And in light of that, the trends we're seeing at Dynacor Gold Mines' (TSE:DNG) look very promising so lets take a look.
What is Return On Capital Employed (ROCE)?
For those who don't know, ROCE is a measure of a company's yearly pre-tax profit (its return), relative to the capital employed in the business. To calculate this metric for Dynacor Gold Mines, this is the formula:
Return on Capital Employed = Earnings Before Interest and Tax (EBIT) ÷ (Total Assets - Current Liabilities)
0.29 = US$23m ÷ (US$95m - US$14m) (Based on the trailing twelve months to March 2022).
So, Dynacor Gold Mines has an ROCE of 29%. In absolute terms that's a great return and it's even better than the Metals and Mining industry average of 2.3%.
View our latest analysis for Dynacor Gold Mines
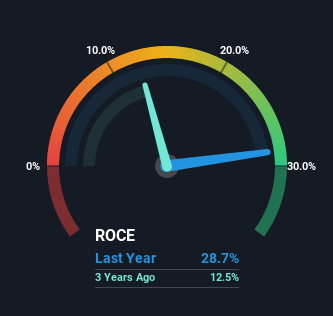
Historical performance is a great place to start when researching a stock so above you can see the gauge for Dynacor Gold Mines' ROCE against it's prior returns. If you're interested in investigating Dynacor Gold Mines' past further, check out this free graph of past earnings, revenue and cash flow.
The Trend Of ROCE
Investors would be pleased with what's happening at Dynacor Gold Mines. The data shows that returns on capital have increased substantially over the last five years to 29%. The company is effectively making more money per dollar of capital used, and it's worth noting that the amount of capital has increased too, by 33%. So we're very much inspired by what we're seeing at Dynacor Gold Mines thanks to its ability to profitably reinvest capital.
On a side note, we noticed that the improvement in ROCE appears to be partly fueled by an increase in current liabilities. The current liabilities has increased to 15% of total assets, so the business is now more funded by the likes of its suppliers or short-term creditors. It's worth keeping an eye on this because as the percentage of current liabilities to total assets increases, some aspects of risk also increase.
In Conclusion...
To sum it up, Dynacor Gold Mines has proven it can reinvest in the business and generate higher returns on that capital employed, which is terrific. And with a respectable 73% awarded to those who held the stock over the last five years, you could argue that these developments are starting to get the attention they deserve. In light of that, we think it's worth looking further into this stock because if Dynacor Gold Mines can keep these trends up, it could have a bright future ahead.
One more thing, we've spotted 2 warning signs facing Dynacor Gold Mines that you might find interesting.
If you want to search for more stocks that have been earning high returns, check out this free list of stocks with solid balance sheets that are also earning high returns on equity.
Have feedback on this article? Concerned about the content? Get in touch with us directly. Alternatively, email editorial-team (at) simplywallst.com.
This article by Simply Wall St is general in nature. We provide commentary based on historical data and analyst forecasts only using an unbiased methodology and our articles are not intended to be financial advice. It does not constitute a recommendation to buy or sell any stock, and does not take account of your objectives, or your financial situation. We aim to bring you long-term focused analysis driven by fundamental data. Note that our analysis may not factor in the latest price-sensitive company announcements or qualitative material. Simply Wall St has no position in any stocks mentioned.
