
 Yahoo Finance
 Why Is Salesforce (CRM) Down 2.6% Since its Last Earnings Report?

It has been about a month since the last earnings report for Salesforce.com Inc CRM. Shares have lost about 2.6% in that time frame.
Will the recent negative trend continue leading up to its next earnings release, or is CRM due for a breakout? Before we dive into how investors and analysts have reacted as of late, let's take a quick look at its most recent earnings report in order to get a better handle on the important catalysts.
Salesforce 4Q18 Results
Salesforce reported fourth-quarter fiscal 2018 non-GAAP earnings of 35 cents per share, which beat the Zacks Consensus Estimate by a couple of cents and came ahead of the guided range of 32-33 cents. The figure jumped 25% primarily driven by strong top-line growth.
Revenues of $2.85 billion increased 24.3% year over year and surpassed the Zacks Consensus Estimate of $2.81 billion. Furthermore, revenues came above the guided range of $2.80-$2.81 billion. Revenues grew 21% at constant currency (cc). The improvement can be primarily attributable to rapid adoption of the company’s cloud-based solutions.
Top-line Details
Now, coming to its business segments, revenues at Subscription and Support increased about 25.8% from the year-ago quarter to $2.66 billion. Professional Services and Other revenues climbed 6.9% to $193.7 million.
Sales Cloud, Service Cloud, Platform and other and Marketing & Commerce Cloud grew 16%, 28%, 37% and 33%, respectively.
Geographically, the company witnessed revenue growth of 19%, 31% and 26% at constant currency (cc) in the Americas, Europe and Asia Pacific, respectively, on a year-over-year basis.
Customer adoption improved in the quarter. Of the top 10 customers up for renewal in the quarter, eight expanded their relationship with Salesforce.
The number of deals worth more than $1 million grew 43% in the quarter. Average deal size continued to expand. Salesforce’s clientele also expanded with the addition of Siemens, ABB, Deutsche Bahn, BBVA, and Alphabet Google during the quarter.
Salesforce is also aggressively penetrating varied industries like financial services and healthcare. During the quarter, the company expanded relationships with TD Bank, Pacific Life, Mass Mutual, Anthem and Cancer Treatment Centers of America.
The company’s ecosystem continues to expand, with 55% of new business generated from partners like Dell, IBM and Amazon. The new strategic partnership with Google will connect Salesforce with Google Cloud and Google Analytics.
The partnership with Amazon Web Services (AWS) has been helping Salesforce expand its international operations in countries like Australia and Canada.
Earlier, the company used to run its software at its own data centers, which was curbing its growth potential. However, the company decided to utilize the AWS data center’s geographical reach to expand its international business. In addition, Salesforce plans to invest about $400 million on AWS’ cloud platform over the next four years.
Margins
Salesforce’s non-GAAP gross profit came in at $2.18 billion, up 25.4% from the year-ago quarter. Gross margin expanded 70 basis points (bps) to 76.6%, primarily owing to solid revenue growth.
Non-GAAP operating expenses increased 24.5% year over year to $1.80 billion. As a percentage of revenues, operating expenses increased 10 bps to 63.1%. The increase in expenses was due to higher commissions and other selling-related expenses.
Management stated that selling costs increased due to accelerated hiring of sales people, international expansion and continuing investments in new businesses.
Salesforce posted non-GAAP operating income of $384.4 million, up 30.2% year over year. Operating margin expanded 60 bps to 13.5% driven by an improved gross margin base and lower operating expenses as a percentage of revenues.
Balance Sheet & Cash Flow
Salesforce exited the quarter with cash, cash equivalents and marketable securities of $4.52 billion compared with $3.63 billion in the previous quarter.
As of Jan 31, 2018, total deferred revenues were $7.09 billion, up 28% on a year-over-year basis (25% at cc). Unbilled deferred revenues surged 48% to $13.3 billion.
Salesforce generated operating cash flow of $2.74 billion and free cash flow of $913.6 million.
Guidance
For first-quarter fiscal 2019, revenues are projected between $2.925 billion and $2.935 billion, an increase of 23% year over year.
Non-GAAP earnings are expected in the range of 43–44 cents per share.
Deferred revenues are anticipated to increase in the range of 23–24% year over year.
For fiscal 2019, revenues are projected between $12.6 billion and $12.65 billion, an increase of 20–21% year over year.
Operating margin is expected to expand 125-150 bps. Non-GAAP earnings are expected in the range of $2.02–$2.04 per share.
Operating cash flow is anticipated to increase in the range of 20–21% year over year. Capital expenditure is expected to be approximately 5% of revenues.
How Have Estimates Been Moving Since Then?
In the past month, investors have witnessed an upward trend in fresh estimates. There have been seven revisions higher for the current quarter. In the past month, the consensus estimate has shifted by 29.7% due to these changes.
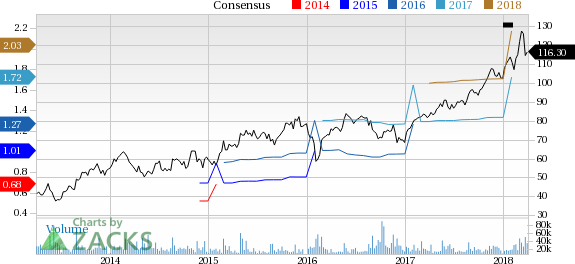
Salesforce.com Inc Price and Consensus
Salesforce.com Inc Price and Consensus | Salesforce.com Inc Quote
VGM Scores
Currently, CRM has a strong Growth Score of A, though it is lagging a bit on the momentum front with a B. However, the stock was allocated a grade of F on the value side, putting it in the bottom 20% quintile for this investment strategy.
Overall, the stock has an aggregate VGM Score of C. If you aren't focused on one strategy, this score is the one you should be interested in.
Our style scores indicate that the stock is more suitable for growth investors than momentum investors.
Outlook
Estimates have been trending upward for the stock and the magnitude of these revisions looks promising. It comes with little surprise CRM has a Zacks Rank #2 (Buy). We expect an above average return from the stock in the next few months.
Want the latest recommendations from Zacks Investment Research? Today, you can download 7 Best Stocks for the Next 30 Days. Click to get this free report
Salesforce.com Inc (CRM) : Free Stock Analysis Report
To read this article on Zacks.com click here.
Zacks Investment Research
