
 Yahoo Finance
 Why We're Not Concerned Yet About Knightscope, Inc.'s (NASDAQ:KSCP) 35% Share Price Plunge
Knightscope, Inc. (NASDAQ:KSCP) shares have retraced a considerable 35% in the last month, reversing a fair amount of their solid recent performance. For any long-term shareholders, the last month ends a year to forget by locking in a 60% share price decline.
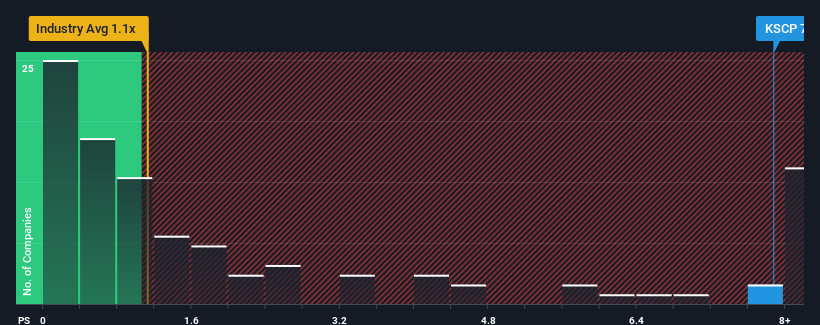
Even after such a large drop in price, you could still be forgiven for thinking Knightscope is a stock to steer clear of with a price-to-sales ratios (or "P/S") of 7.9x, considering almost half the companies in the United States' Commercial Services industry have P/S ratios below 1.1x. Nonetheless, we'd need to dig a little deeper to determine if there is a rational basis for the highly elevated P/S.
View our latest analysis for Knightscope
How Has Knightscope Performed Recently?
Knightscope certainly has been doing a good job lately as it's been growing revenue more than most other companies. The P/S is probably high because investors think this strong revenue performance will continue. However, if this isn't the case, investors might get caught out paying too much for the stock.
Want the full picture on analyst estimates for the company? Then our free report on Knightscope will help you uncover what's on the horizon.
How Is Knightscope's Revenue Growth Trending?
The only time you'd be truly comfortable seeing a P/S as steep as Knightscope's is when the company's growth is on track to outshine the industry decidedly.
If we review the last year of revenue growth, the company posted a terrific increase of 180%. The latest three year period has also seen an excellent 234% overall rise in revenue, aided by its short-term performance. Therefore, it's fair to say the revenue growth recently has been superb for the company.
Turning to the outlook, the next year should generate growth of 50% as estimated by the one analyst watching the company. That's shaping up to be materially higher than the 11% growth forecast for the broader industry.
In light of this, it's understandable that Knightscope's P/S sits above the majority of other companies. It seems most investors are expecting this strong future growth and are willing to pay more for the stock.
What We Can Learn From Knightscope's P/S?
A significant share price dive has done very little to deflate Knightscope's very lofty P/S. It's argued the price-to-sales ratio is an inferior measure of value within certain industries, but it can be a powerful business sentiment indicator.
Our look into Knightscope shows that its P/S ratio remains high on the merit of its strong future revenues. It appears that shareholders are confident in the company's future revenues, which is propping up the P/S. It's hard to see the share price falling strongly in the near future under these circumstances.
There are also other vital risk factors to consider and we've discovered 5 warning signs for Knightscope (3 make us uncomfortable!) that you should be aware of before investing here.
If companies with solid past earnings growth is up your alley, you may wish to see this free collection of other companies with strong earnings growth and low P/E ratios.
Have feedback on this article? Concerned about the content? Get in touch with us directly. Alternatively, email editorial-team (at) simplywallst.com.
This article by Simply Wall St is general in nature. We provide commentary based on historical data and analyst forecasts only using an unbiased methodology and our articles are not intended to be financial advice. It does not constitute a recommendation to buy or sell any stock, and does not take account of your objectives, or your financial situation. We aim to bring you long-term focused analysis driven by fundamental data. Note that our analysis may not factor in the latest price-sensitive company announcements or qualitative material. Simply Wall St has no position in any stocks mentioned.
