
 Yahoo Finance
 Why you should always be ready for a big, scary stock market sell-off

Usually, stocks go up.
But they also come down. And more often than you think.
“The question is only one of timing and magnitude,” writes David Rosenberg, strategist at Gluskin Sheff.
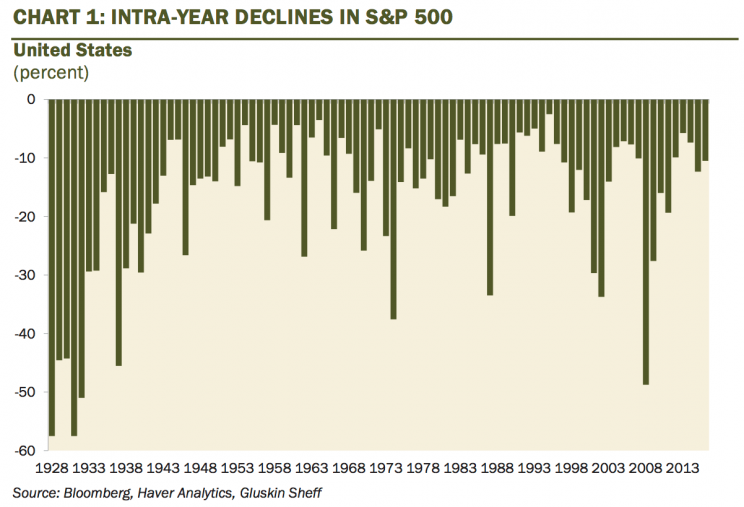
Only once in the last 89 years has the S&P 500 not dropped at least 4.4% from an interim peak, and in 2016 there were four of these occurrences. In 2016, the S&P 500 rose 9.5%.
“Full three-quarters of the time, these intra-year corrections were 10% or more (the average was 17% and median was 13%),” Rosenberg wrote. “And keep in mind these also occur in the context of bull markets and expanding economies — often event-driven.”
On Wednesday, for example, the Dow rose for its 9th-straight session — the longest streak since 1987. And if you know even a little bit about market history, you know 1987 is the years of the infamous “Black Monday” crash that saw the Dow lose 22% in just a single day.
This crash, however, also came in the context of one of the biggest bull-market runs of all time, with the S&P 500 rising from about 120 to north of 1,400 from 1982 to 2000. On Thursday, the S&P 500 was trading at around 2,360.
And thinking to even more recent market history, recall the sharp, violent, and ultimately short-lived declines in markets we saw in October 2014, January-February 2015, August 2015, and January 2016. This also leaves out the brutal overnight moves we saw during Brexit and the US election.

In a note earlier this week highlighted by Yahoo Finance’s Sam Ro, Rosenberg outlined a simple list of 10 things for investors to keep in mind as stocks elevate to new records. Among these red flags are investor sentiment turning unabashedly bullish, earnings expectations lagging the rally in prices, and the S&P 500 climbing north of year-end targets for over half of Wall Street’s strategists.
Is this a reason to worry about the market, then? Well, sure. Worrying is a sort of default setting for most investors. There is always something to worry about.
And while traders or short-term investors might be viewing the recent rally as a chance to tactically position for a decline, as we highlighted late last year, long-term investors are seriously hurt by moving in and out of markets. Missing the 10 best trading days in each of the last nine decades would have, for example, seen investors gain 31% over the period instead of 10,055%.
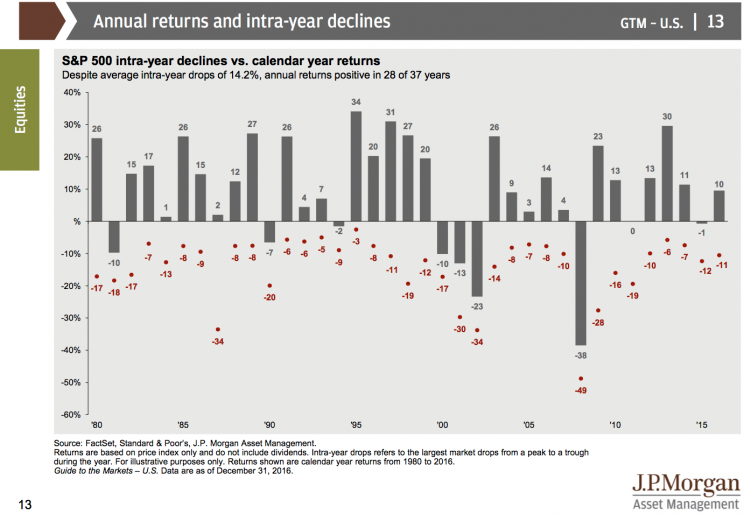
And as this chart from JP Morgan Wealth Management shows, perhaps the only thing investors can count on is that just as stocks go up, they will also go down. Every year.
—
Myles Udland is a writer at Yahoo Finance. Follow him on Twitter @MylesUdland
Read more from Myles here:
