
 Yahoo Finance
 Should You Worry About The Telstra Corporation Limited’s (ASX:TLS) Shareholder Register?

Every investor in Telstra Corporation Limited (ASX:TLS) should be aware of the most powerful shareholder groups. Generally speaking, as a company grows, institutions will increase their ownership. Conversely, insiders often decrease their ownership over time. Companies that used to be publicly owned tend to have lower insider ownership.
With a market capitalization of AU$36.95b, Telstra is rather large. We’d expect to see institutional investors on the register. Companies of this size are usually well known to retail investors, too. Taking a look at the our data on the ownership groups (below), it’s seems that institutions own shares in the company. We can zoom in on the different ownership groups, to learn more about TLS.
See our latest analysis for Telstra
What Does The Institutional Ownership Tell Us About Telstra?
Institutional investors commonly compare their own returns to the returns of a commonly followed index. So they generally do consider buying larger companies that are included in the relevant benchmark index.
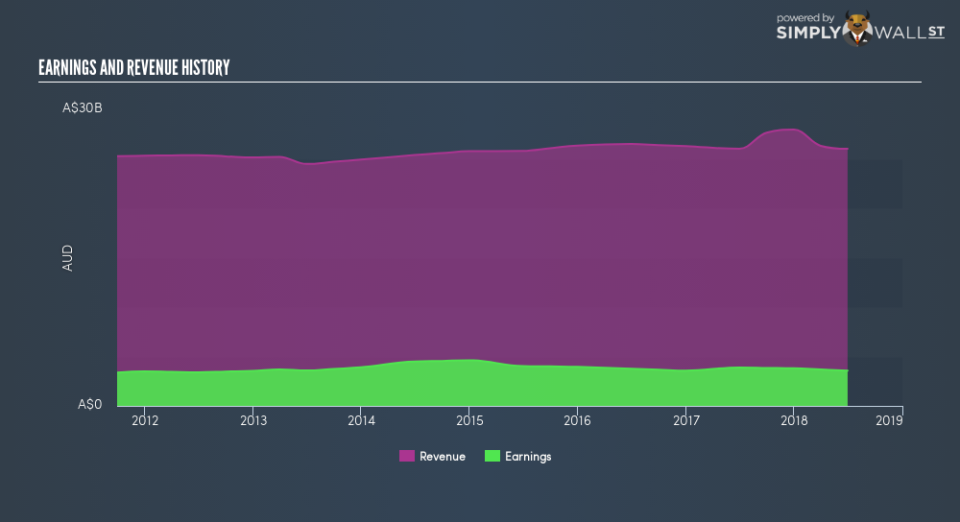
As you can see, institutional investors own 13.0% of Telstra. This implies the analysts working for those institutions have looked at the stock and they like it. But just like anyone else, they could be wrong. It is not uncommon to see a big share price drop if two large institutional investors try to sell out of a stock at the same time. So it is worth checking the past earnings trajectory of Telstra, (below). Of course, keep in mind that there are other factors to consider, too.
Hedge funds don’t have many shares in Telstra. There are plenty of analysts covering the stock, so it might be worth seeing what they are forecasting, too.
Insider Ownership Of Telstra
The definition of an insider can differ slightly between different countries, but members of the board of directors always count. Management ultimately answers to the board. However, it is not uncommon for managers to be executive board members, especially if they are a founder or the CEO.
Insider ownership is positive when it signals leadership are thinking like the true owners of the company. However, high insider ownership can also give immense power to a small group within the company. This can be negative in some circumstances.
Our data suggests that insiders own under 1% of Telstra Corporation Limited in their own names. Being so large, we would not expect insiders to own a large proportion of the stock. Collectively, they own AU$14.6m of stock. In this sort of situation, it can be more interesting to see if those insiders have been buying or selling.
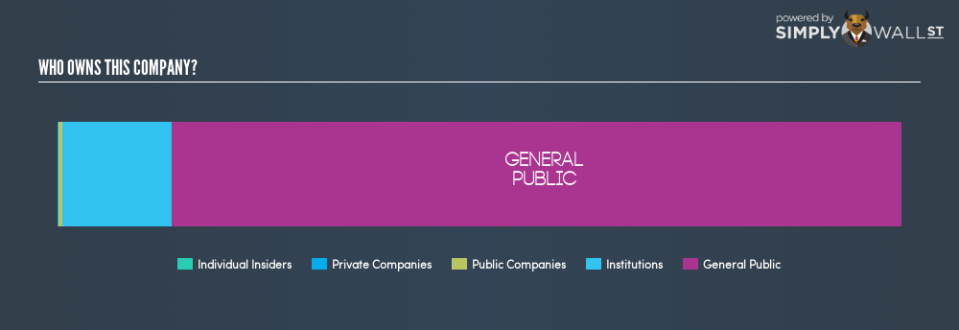
General Public Ownership
The general public — mostly retail investors — own 86.3% of Telstra . This level of ownership gives retail investors the power to sway key policy decisions such as board composition, executive compensation, and the dividend payout ratio.
Next Steps:
It’s always worth thinking about the different groups who own shares in a company. But to understand Telstra better, we need to consider many other factors.
I always like to check for a history of revenue growth. You can too, by accessing this free chart of historic revenue and earnings in this detailed graph.
Ultimately the future is most important. You can access this free report on analyst forecasts for the company.
NB: Figures in this article are calculated using data from the last twelve months, which refer to the 12-month period ending on the last date of the month the financial statement is dated. This may not be consistent with full year annual report figures.
To help readers see past the short term volatility of the financial market, we aim to bring you a long-term focused research analysis purely driven by fundamental data. Note that our analysis does not factor in the latest price-sensitive company announcements.
The author is an independent contributor and at the time of publication had no position in the stocks mentioned. For errors that warrant correction please contact the editor at editorial-team@simplywallst.com.
