
 Yahoo Finance
 When Will XPON Technologies Group Limited (ASX:XPN) Become Profitable?
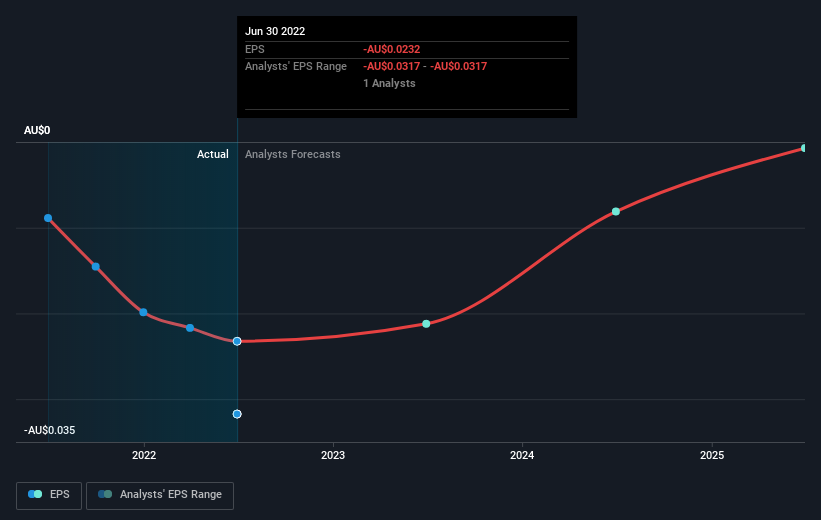
XPON Technologies Group Limited (ASX:XPN) is possibly approaching a major achievement in its business, so we would like to shine some light on the company. XPON Technologies Group Limited provides mission-critical services and software solutions to businesses in Australia, New Zealand, the United Kingdom, and Europe. The AU$49m market-cap company announced a latest loss of AU$6.3m on 30 June 2022 for its most recent financial year result. Many investors are wondering about the rate at which XPON Technologies Group will turn a profit, with the big question being “when will the company breakeven?” We've put together a brief outline of industry analyst expectations for the company, its year of breakeven and its implied growth rate.
See our latest analysis for XPON Technologies Group
According to some industry analysts covering XPON Technologies Group, breakeven is near. They anticipate the company to incur a final loss in 2024, before generating positive profits of AU$500k in 2025. The company is therefore projected to breakeven around 3 years from today. How fast will the company have to grow each year in order to reach the breakeven point by 2025? Working backwards from analyst estimates, it turns out that they expect the company to grow 64% year-on-year, on average, which is extremely buoyant. Should the business grow at a slower rate, it will become profitable at a later date than expected.
Given this is a high-level overview, we won’t go into details of XPON Technologies Group's upcoming projects, however, bear in mind that by and large a high growth rate is not out of the ordinary, particularly when a company is in a period of investment.
One thing we’d like to point out is that The company has managed its capital judiciously, with debt making up 0.6% of equity. This means that it has predominantly funded its operations from equity capital, and its low debt obligation reduces the risk around investing in the loss-making company.
Next Steps:
This article is not intended to be a comprehensive analysis on XPON Technologies Group, so if you are interested in understanding the company at a deeper level, take a look at XPON Technologies Group's company page on Simply Wall St. We've also compiled a list of essential factors you should look at:
Valuation: What is XPON Technologies Group worth today? Has the future growth potential already been factored into the price? The intrinsic value infographic in our free research report helps visualize whether XPON Technologies Group is currently mispriced by the market.
Management Team: An experienced management team on the helm increases our confidence in the business – take a look at who sits on XPON Technologies Group’s board and the CEO’s background.
Other High-Performing Stocks: Are there other stocks that provide better prospects with proven track records? Explore our free list of these great stocks here.
Have feedback on this article? Concerned about the content? Get in touch with us directly. Alternatively, email editorial-team (at) simplywallst.com.
This article by Simply Wall St is general in nature. We provide commentary based on historical data and analyst forecasts only using an unbiased methodology and our articles are not intended to be financial advice. It does not constitute a recommendation to buy or sell any stock, and does not take account of your objectives, or your financial situation. We aim to bring you long-term focused analysis driven by fundamental data. Note that our analysis may not factor in the latest price-sensitive company announcements or qualitative material. Simply Wall St has no position in any stocks mentioned.
Join A Paid User Research Session
You’ll receive a US$30 Amazon Gift card for 1 hour of your time while helping us build better investing tools for the individual investors like yourself. Sign up here
