
 Yahoo Finance
 Yiren Digital (NYSE:YRD) adds US$34m to market cap in the past 7 days, though investors from five years ago are still down 90%
Yiren Digital Ltd. (NYSE:YRD) shareholders should be happy to see the share price up 19% in the last week. But that doesn't change the fact that the returns over the last half decade have been stomach churning. Like a ship taking on water, the share price has sunk 90% in that time. So we don't gain too much confidence from the recent recovery. The million dollar question is whether the company can justify a long term recovery. While a drop like that is definitely a body blow, money isn't as important as health and happiness.
Although the past week has been more reassuring for shareholders, they're still in the red over the last five years, so let's see if the underlying business has been responsible for the decline.
See our latest analysis for Yiren Digital
To paraphrase Benjamin Graham: Over the short term the market is a voting machine, but over the long term it's a weighing machine. One flawed but reasonable way to assess how sentiment around a company has changed is to compare the earnings per share (EPS) with the share price.
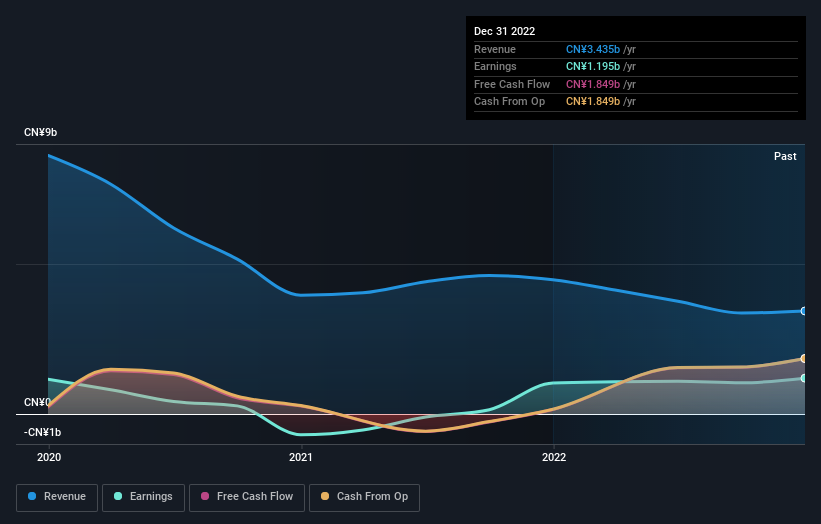
Yiren Digital became profitable within the last five years. Most would consider that to be a good thing, so it's counter-intuitive to see the share price declining. Other metrics might give us a better handle on how its value is changing over time.
Arguably, the revenue drop of 23% a year for half a decade suggests that the company can't grow in the long term. That could explain the weak share price.
You can see how earnings and revenue have changed over time in the image below (click on the chart to see the exact values).
You can see how its balance sheet has strengthened (or weakened) over time in this free interactive graphic.
A Different Perspective
It's good to see that Yiren Digital has rewarded shareholders with a total shareholder return of 42% in the last twelve months. Notably the five-year annualised TSR loss of 14% per year compares very unfavourably with the recent share price performance. We generally put more weight on the long term performance over the short term, but the recent improvement could hint at a (positive) inflection point within the business. It's always interesting to track share price performance over the longer term. But to understand Yiren Digital better, we need to consider many other factors. Case in point: We've spotted 2 warning signs for Yiren Digital you should be aware of.
For those who like to find winning investments this free list of growing companies with recent insider purchasing, could be just the ticket.
Please note, the market returns quoted in this article reflect the market weighted average returns of stocks that currently trade on American exchanges.
Have feedback on this article? Concerned about the content? Get in touch with us directly. Alternatively, email editorial-team (at) simplywallst.com.
This article by Simply Wall St is general in nature. We provide commentary based on historical data and analyst forecasts only using an unbiased methodology and our articles are not intended to be financial advice. It does not constitute a recommendation to buy or sell any stock, and does not take account of your objectives, or your financial situation. We aim to bring you long-term focused analysis driven by fundamental data. Note that our analysis may not factor in the latest price-sensitive company announcements or qualitative material. Simply Wall St has no position in any stocks mentioned.
Join A Paid User Research Session
You’ll receive a US$30 Amazon Gift card for 1 hour of your time while helping us build better investing tools for the individual investors like yourself. Sign up here
